Figure 5.
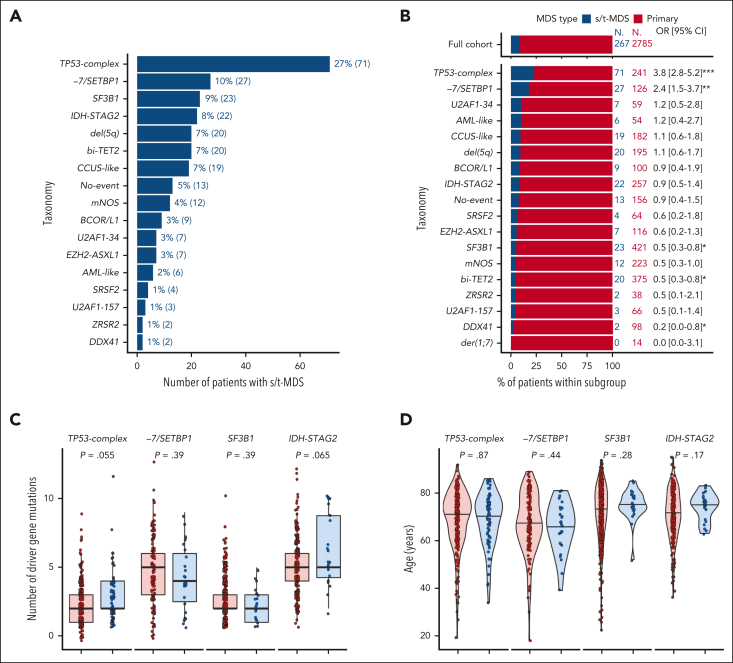
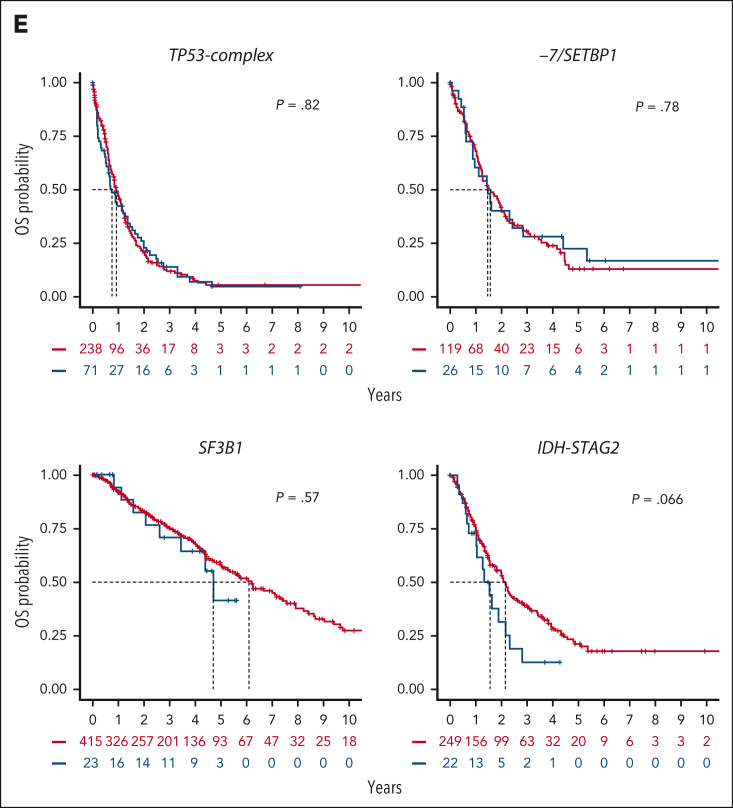
Genetic heterogeneity of s/t-MDS. (A) Prevalence of molecular groups in 267 patients with s/t-MDS. (B) Proportion of primary (red) and s/t-MDS (blue) within each molecular group and comparison with the full cohort (top). (C) Distribution of the number of mutated genes per patient in primary or s/t-MDS within each molecular group (TP53-complex, −7/SETBP1, SF3B1, and IDH-STAG2), showing similar molecular complexity of the 2 disease subsets. For example, the median number of mutated genes per patient was equal to 2 for both primary and s/t-MDS within TP53-complex, whereas it was equal to 5 for both subsets within IDH-STAG2. (D) Age distribution in primary or s/t-MDS within each molecular group. (E) Kaplan-Meier probability estimates of OS for primary or s/t-MDS within each molecular group. P values are from the log-rank test.


