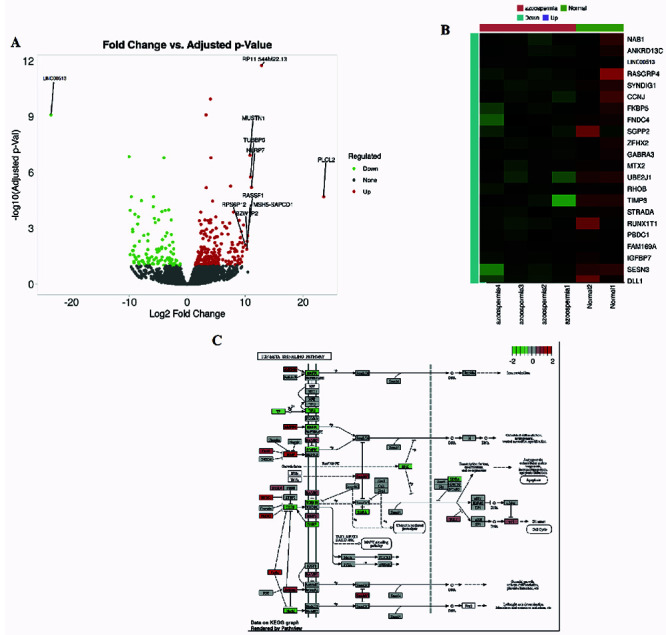
Figure 1.

Meta-analysis and pathway enrichment analysis of RNA-Seq datasets. A) Heatmap plot of gene expression levels for differentially expressed genes identified in our study and consistent with those identified in the meta-analysis. Genes are color-coded according to their fold change (log2FC); B) Volcano plot of gene expression levels for differentially expressed genes identified in our study and consistent with those identified in the meta-analysis. Genes are color-coded according to their p-value (-log10 (p-value)) and fold change (log2FC); C) Network diagram of the Linc00513-miR-7-TGF-β axis, highlighting the genes that were found to be differentially expressed in our study.
