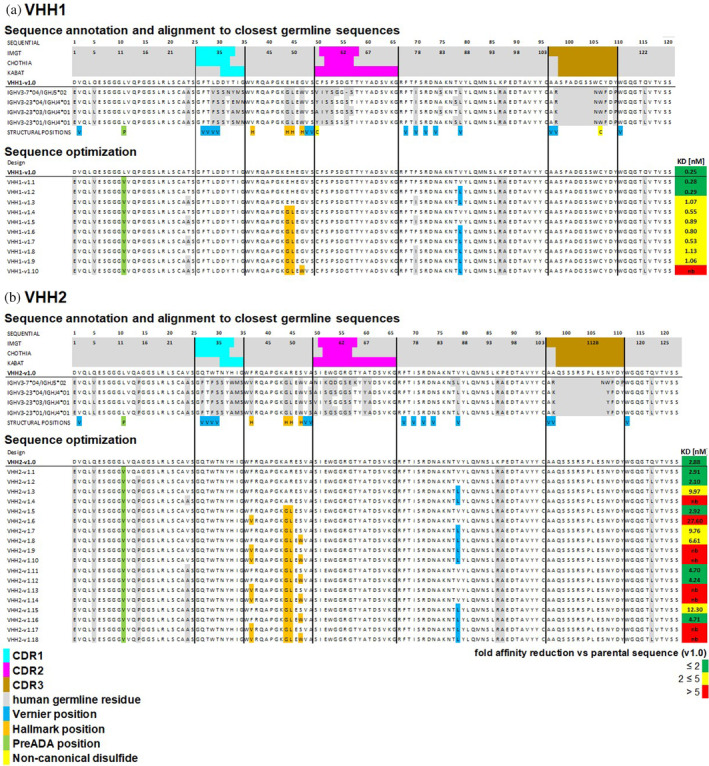
FIGURE 1.

(a) VHH1 and (b) VHH2 sequence annotations and alignment to the most similar germline sequences. The first three rows indicate CDR1‐3 (cyan, magenta, brown) residues according to IMGT, Chothia and Kabat nomenclature in green. The fourth row shows the sequence of parental VHHs and the following four rows the alignment to the most similar germline sequences. Amino acid differences to the most similar germline sequence are indicated in gray. The last row shows residues in different key structural positions: Vernier positions (indicated in blue), Hallmark positions (orange), one position known to be essential for binding to preADAs (green) and non‐canonical cysteines (yellow). Sequence optimization: Designed variants towards increased human‐likeness in the framework regions. Mutations that have been introduced in key structural positions are colored accordingly. For straightforward sequence activity relationship (SAR) analysis, the KD values (Table 1) are added at the end of each designed sequence and are complemented with a green to red coloring based on the affinity reduction compared to the parental sequence.
