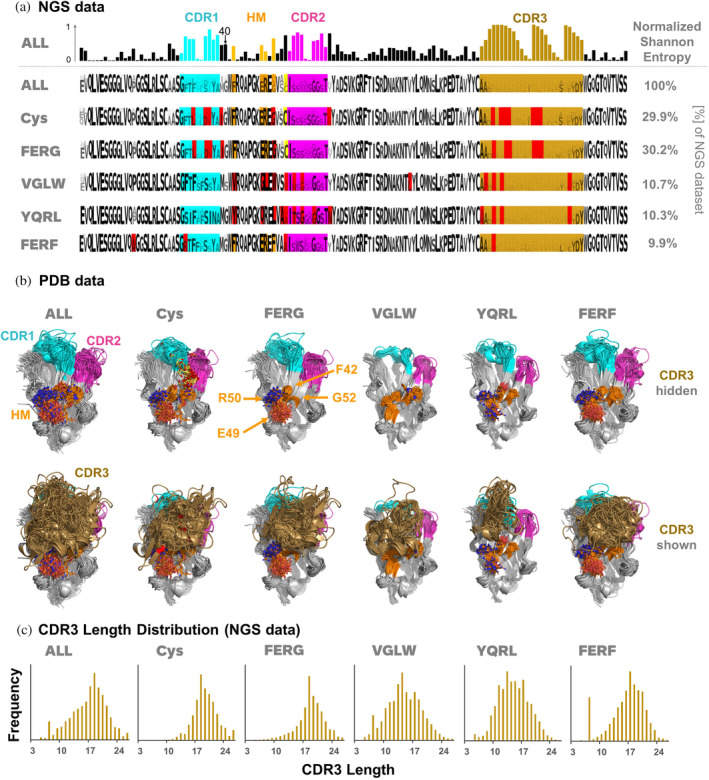
FIGURE 8.

Visualization of (a) sequence and (b) structure diversity of VHHs as observed in NGS and PDB data. (a) Normalized Shannon entropy of residues along the VHH sequence (top row) and sequence logos of the entire VHH NGS data set (ALL) and for specific subsets, together with their percentages observed in the dataset. Positions colored in red indicate that the most prevalent residue in this position is different from the most prevalent residue in the entire dataset (ALL). (b) 3D‐alignment of PDB structures, based on the same subset definitions as for the NGS subsets. For clarity, CDR3 is hidden in the upper row and shown in the lower row. (c) CDR3 length distribution over the entire NGS data set and for the specific subsets. Key residues are indicated in the same color coding as in Figure 1. CDR and FR definitions are based on the IMGT nomenclature.
