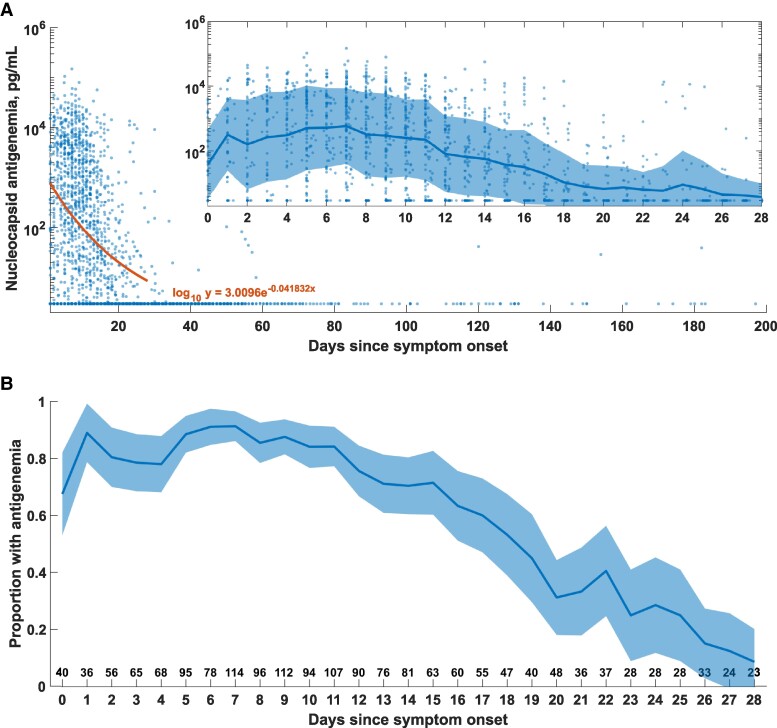
Figure 4.
Antigenemia kinetics. A, Antigenemia levels vs days since symptom onset for source data from 10 studies. All measurements below the threshold value were plotted at 2.97 pg/mL. An exponential fit to the log10 of antigenemia level vs day of symptoms was performed. A-inset axes, Details of 28-day kinetics following COVID-19 symptom onset. The line and shaded region represent the mean and standard deviation of the log10 of the antigenemia level. B, Proportion of patients represented in source data with antigenemia >2.97 pg/mL as a function of days of symptoms. For data where more precise symptom durations were provided, values were rounded down to the nearest integer. The shaded region represents the 95% CI calculated for each time point using the formula for standard error. The number below indicates the total number of cases in the aggregate data set at each time point. Abbreviation: COVID-19, coronavirus disease 2019.

