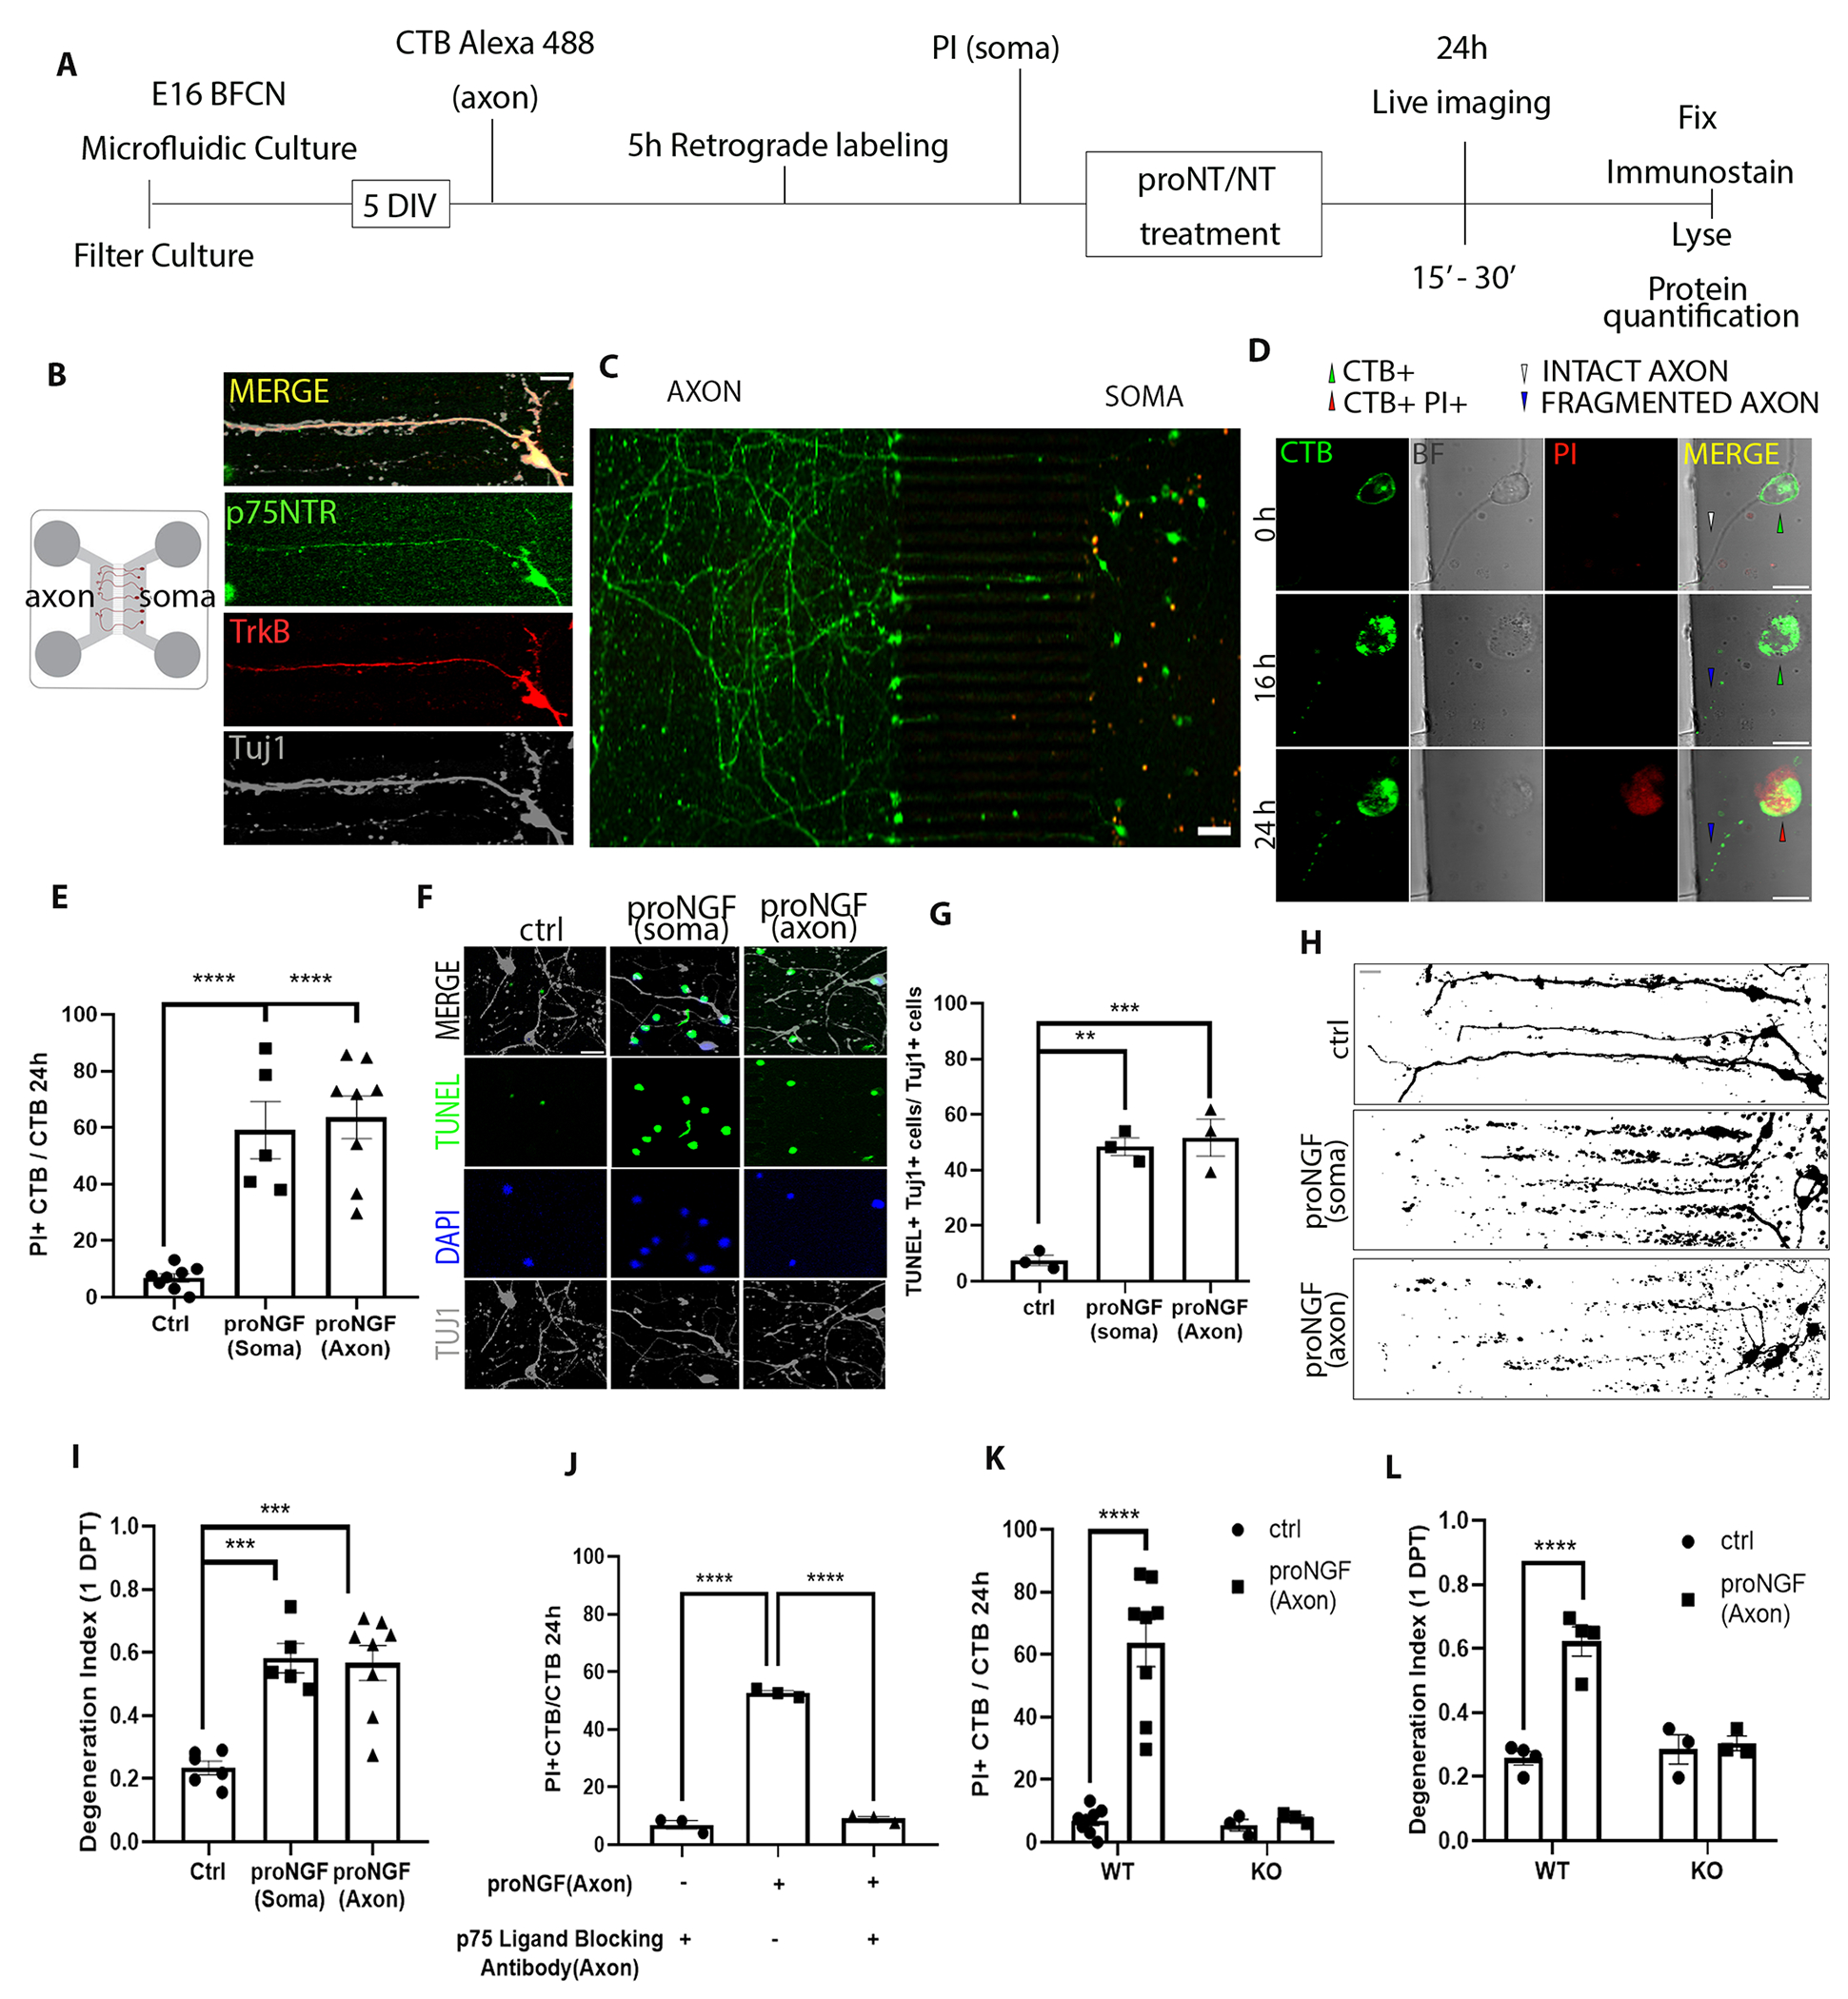
Figure 1. proNGF promotes retrograde degeneration of basal forebrain cholinergic neurons (BFCNs) in microfluidic cultures through p75NTR.

(A to C) Schematic of the experiment in (A), in which E16 rat basal forebrain neurons were cultured in microfluidic chambers for 5 DIV and traced with CTB Alexa-488 retrogradely, from the axon. Propidium iodide (PI) was added to the soma compartment to identify dying neurons following treatment. ProNGF was applied to either soma or axon, as indicated in each figure or legend. Imaging in (B and C) are representative images of p75NTR (green), TrkB (red), and β-tubulin III (Tuj1) in wild-type BFCN axons and somas cultured and treated as described in (A), from at least 5 experiments. Scale bars = 20 μm (B), 50 μm (C). (D) Live-cell imaging for axon fragmentation (CTB) and PI uptake in the nucleus 16 and 24 hours after axonal proNGF stimulation. BF, brightfield. Scale bar = 10μm. Images are representative of 5 experiments in wild-type BFCNs. (E) From imaging described in (D), quantification of dying BFCNs, as the proportion of CTB-positive soma that were PI positive, 24 hours after either soma or axonal treatment with proNGF. Data are mean ± SEM of n = 5 or 8 independent experiments from separate litters, each experiment with technical duplicates and analysis of at least 50 cells per treatment. ****p<0.0001 by one-way ANOVA with Tukey’s multiple comparison tests. (F and G) Wild-type BFCN somas in microfluidic chambers were co-labeled for TUNEL (green), DAPI (blue) and Tuj1 (grey) and treated with proNGF at the soma or the axon. Images were taken 24 hours later (scale bar = 20μm) and analyzed for the proportion of TUNEL-positive Tuj1-positive cells. Data are mean ± SEM of n = 3 independent experiments, each with technical duplicates and analysis of at least 50 cells per treatment. **p < 0.01, ***p < 0.001 by one-way ANOVA with Tukey’s multiple comparison tests. (H and I) Binary images of Tuj1-immunostained BFCNs (scale bar = 20μm) and quantification of axon fragmentation represented as a degeneration index comparing BFCNs treated with proNGF in the soma or axons and control untreated neurons. Data are mean ± SEM of n = 5 or 8 independent experiments, each with technical duplicates and analysis of at least 50 cells per treatment. ***p < 0.001 by one-way ANOVA with Tukey’s multiple comparison tests. (J) Analysis of cell death in wild-type BFCNs, assessed by live-cell imaging as described in (D and E), 24 hours after axonal treatment with proNGF with or without axonal pretreatment with a p75NTR ligand-blocking antibody (1 μg/ml for 20 min). Data are mean ± SEM of n = 3 independent experiments, each with technical duplicates and analysis of at least 50 cells per treatment. ****p<0.0001 by one-way ANOVA with Tukey’s multiple comparison tests. (K) Analysis of cell death in wild-type (WT) and p75NTR-deficient (KO) BFCNs, assessed by live-cell imaging as described in (D and E), 24 hours after axonal proNGF treatment. Data are mean ± SEM of n= 3 or 8 independent experiments, each with technical duplicates and analysis of at least 50 cells per treatment. ****p < 0.0001 by two-way ANOVA with Sidak’s multiple comparison tests. (L) Degeneration index, assessed by Tuj1 immunostaining as described in (H), in p75NTR wild-type (WT) and knockout (KO) BFCNs after axonal treatment with proNGF. Data are mean ± SEM of n= 3 and 4 independent experiments, each with technical duplicates and at least 50 cells analyzed per treatment. ****p < 0.0001 by Sidak’s multiple comparison tests.
