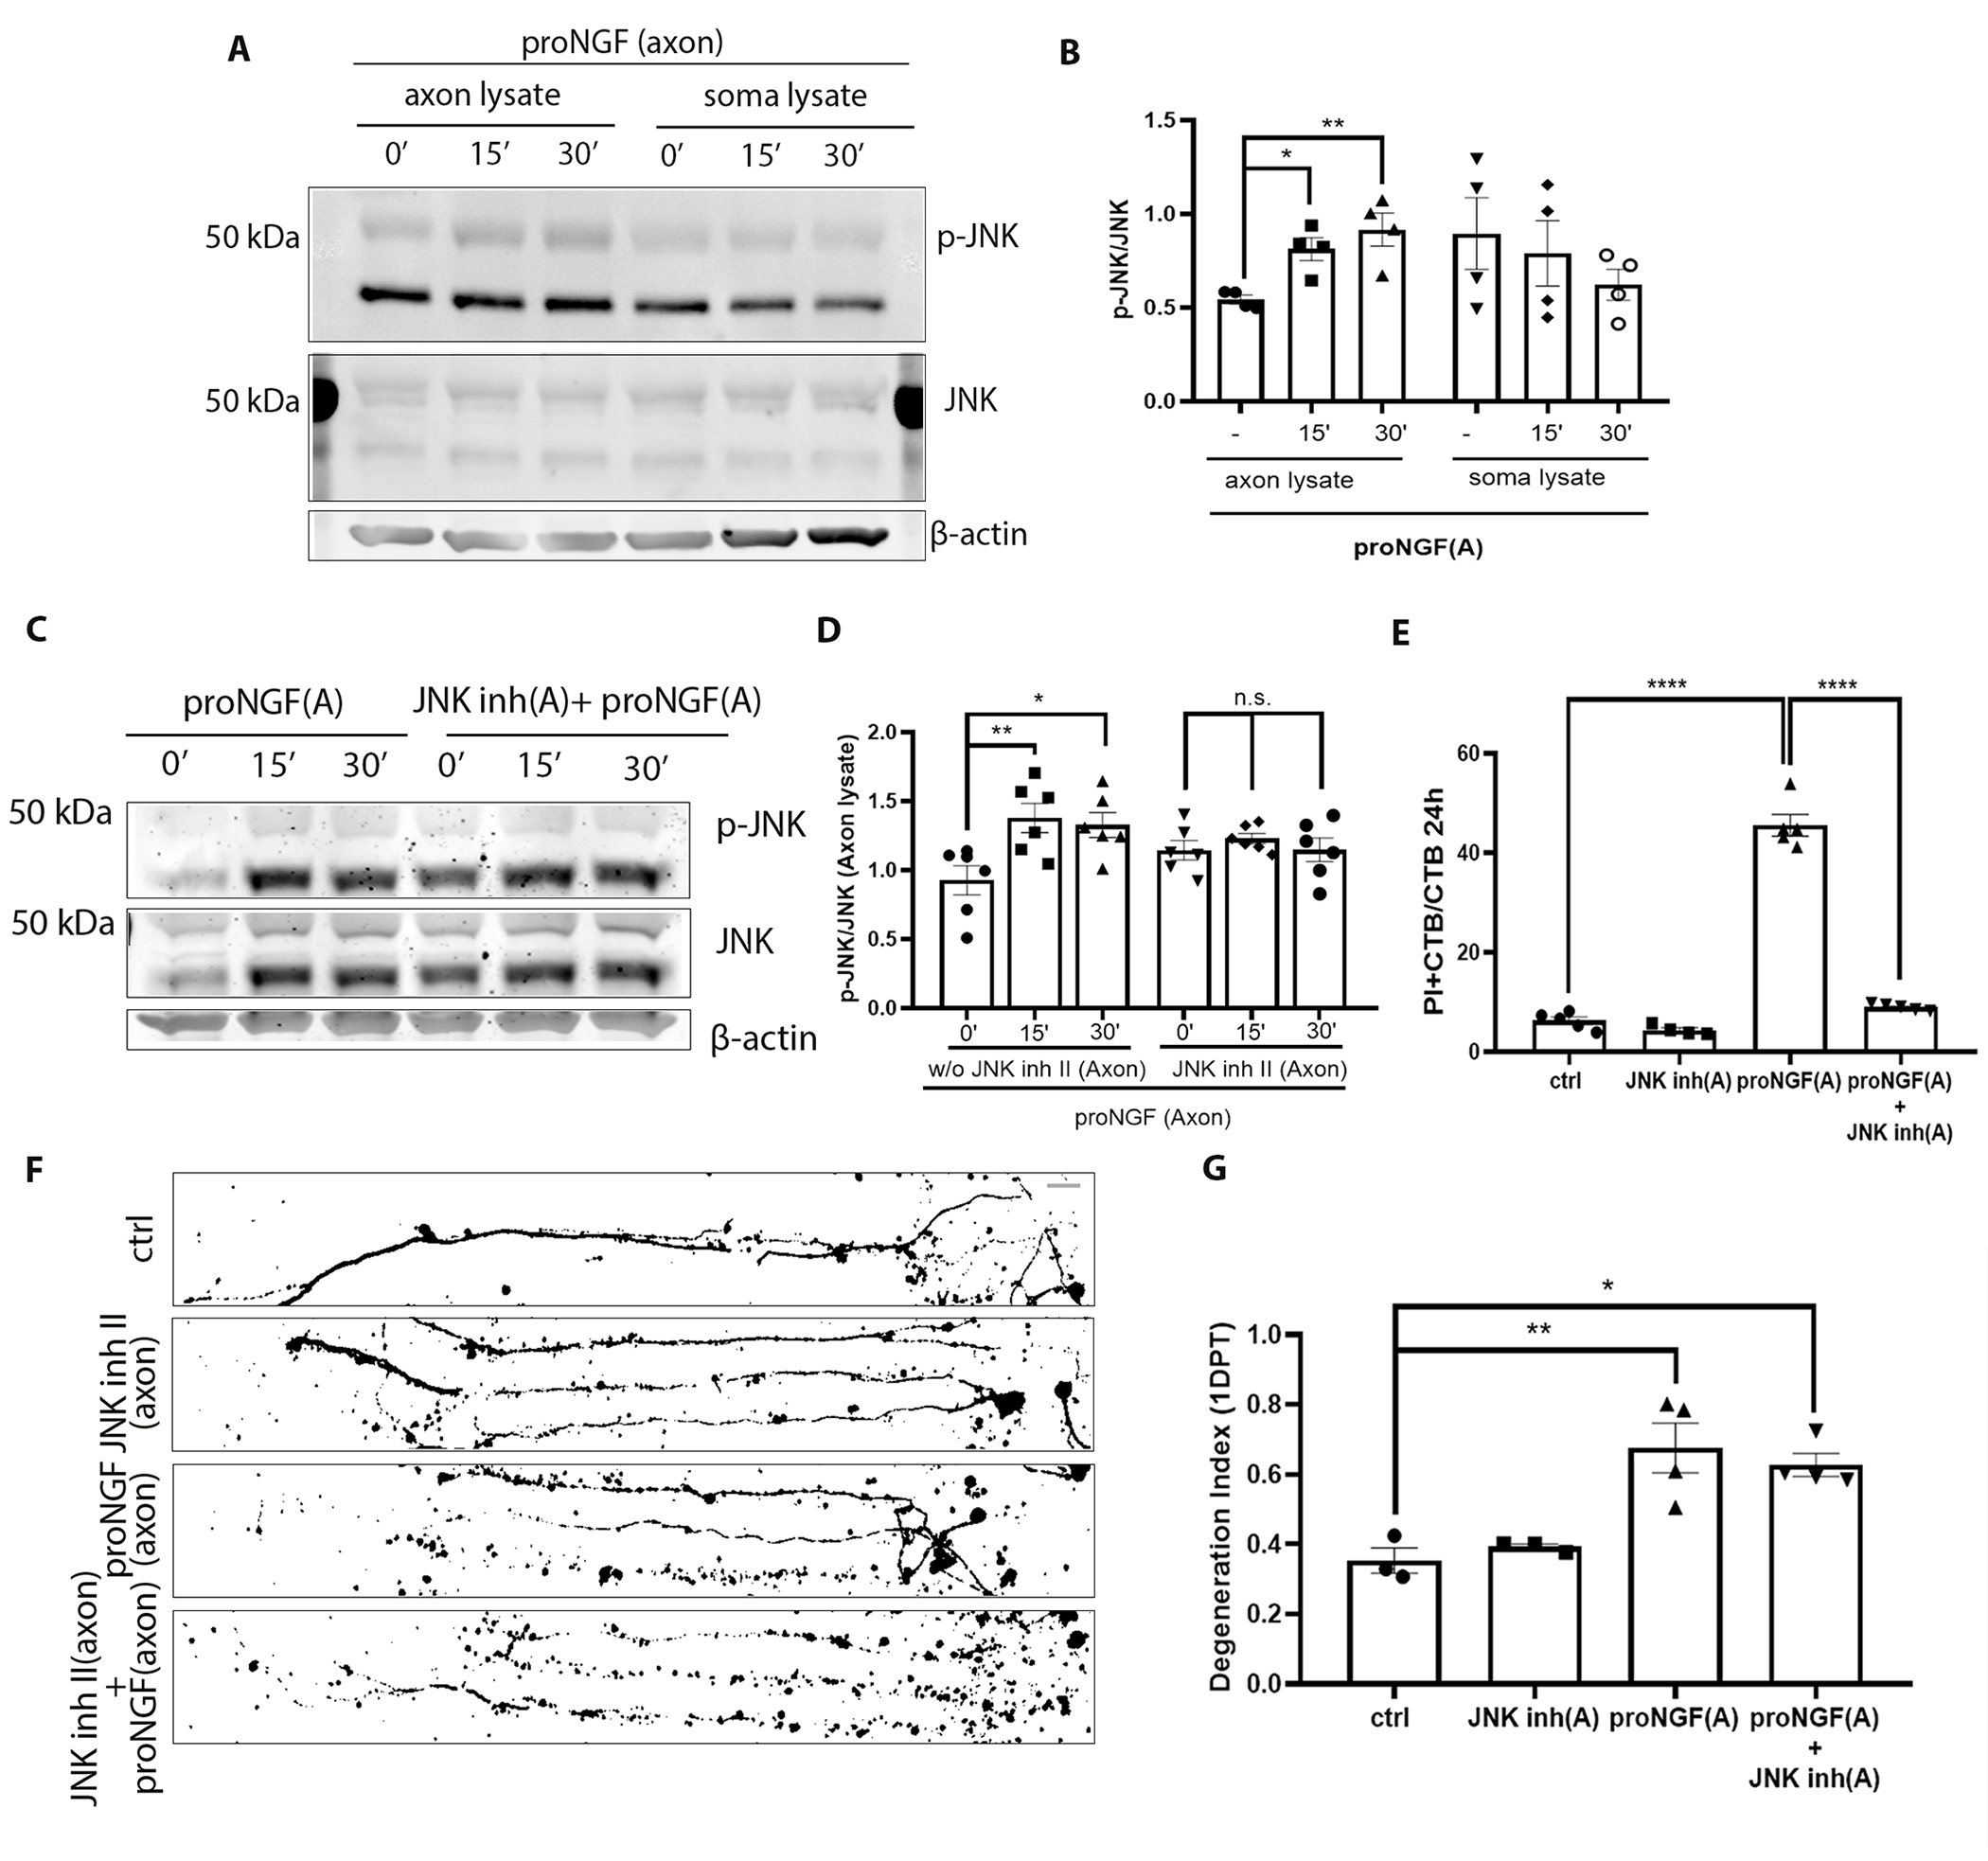
Figure 3. JNK activity is necessary for proNGF induced retrograde BFCN cell death but not axon degeneration.

(A and B) Western blot images of total and phosphorylated JNK levels in the BFCN axon and soma lysates after axon stimulation with proNGF for 15 and 30 mins. Quantification of p-JNK is relative to JNK in the axon and soma lysates. Data are mean ± SEM, n = 4 independent experiments. *p < 0.05, **p < 0.01. (C and D) Western blot images and analysis of total and phosphorylated JNK with β-actin in the BFCN axon and soma lysates after axon stimulation with proNGF for 15 and 30 mins with or without JNK inhibitor II in the axons. Data are mean ± SEM, n = 6 independent experiments. **p < 0.01, *p < 0.05. (E) BFCNs plated in microfluidic chambers were pre-treated with JNK inhibitor II in the axons before axonal proNGF treatment [“(A)” in axis labels = axonal application]. Quantifications of the proportion of PI+ CTB BFCNs after 24 hours treatment are from n = 4 or 5 independent experiments. ****p < 0.0001. (F and G) Binary images of Tuj1-labeled BFCNs 24 hours after axonal application of JNK inhibitor II, proNGF, or both, and control untreated BFCNs, with quantification of a degeneration Index. Data are mean ± SEM from n = 3 or 4 independent experiments per treatment. Scale bar = 20μm. p** < 0.01, p* <0.05. All statistical analyses (B to G) were performed using ordinary one-way ANOVA with Tukey’s multiple comparisons test.
