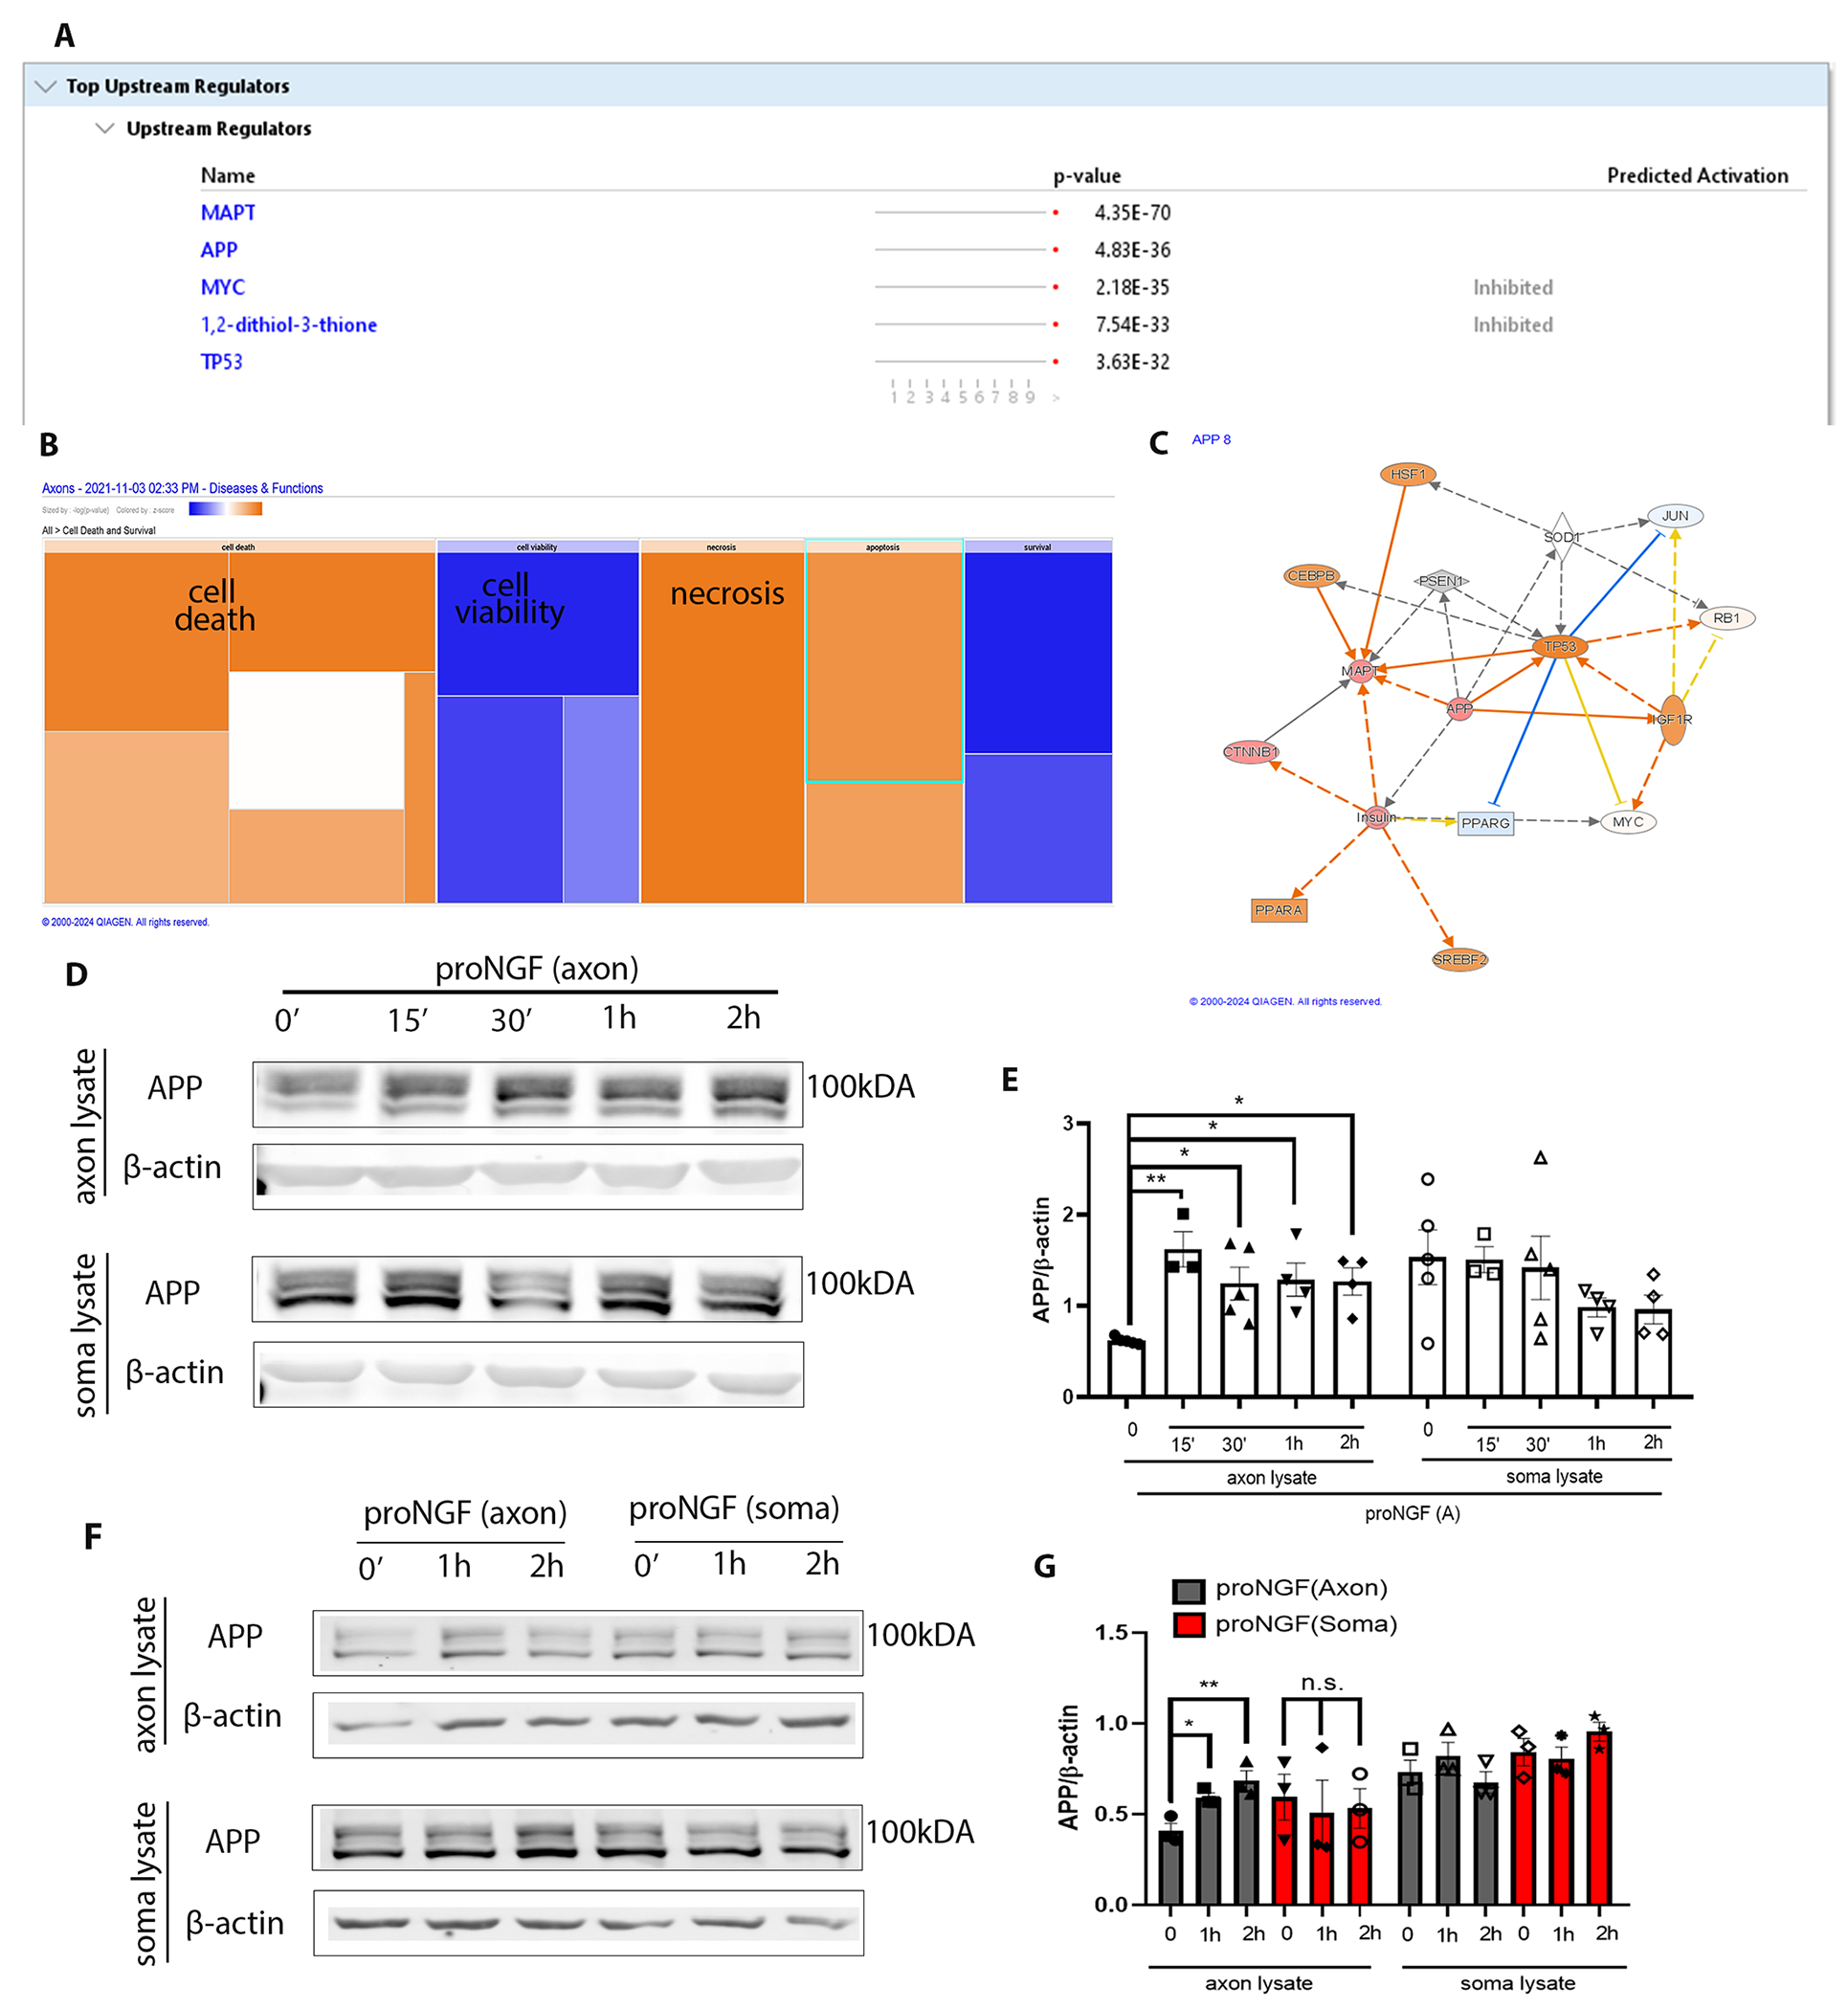
Figure 5. proNGF induces new protein synthesis in the axons, associated with cell death and degeneration.

(A and B) Axons of BFCNs plated in filter cultures were treated with proNGF for 30 min, followed by capture of nascent axonal proteins using O-propargyl-puromycin (OPP), which were subjected to mass spectrometry (A) and IPA analysis (B). Samples from 3 independent experiments were combined for analysis. Predicted increases are represented with a scale of orange, predicted decreases represented with a scale of blue, and no significant change in prediction is represented with white. (C) Functional network of significantly regulated proteins from (A) created using IPA analysis with APP as a central regulator. Predicted increase in measurement is represented in red; activation in orange; inhibition in blue. (D and E) Western blotting and analysis of APP levels in the BFCN axons and somas after axon stimulation with proNGF for 15 min to 2 hours. Density was quantified relative to that of β-actin. Data are means ± SEM of n = 3 to 5 independent experiments. *p<0.05, **p<0.001 by ordinary one-way ANOVA with Tukey’s multiple comparison tests. (F and G) Western blot analysis of APP and β-actin levels in the BFCN axons and somas after axon or soma stimulation with proNGF for 1 or 2 hours. Quantification and statistical analysis as in (E), from n = 3 independent experiments per treatment.
