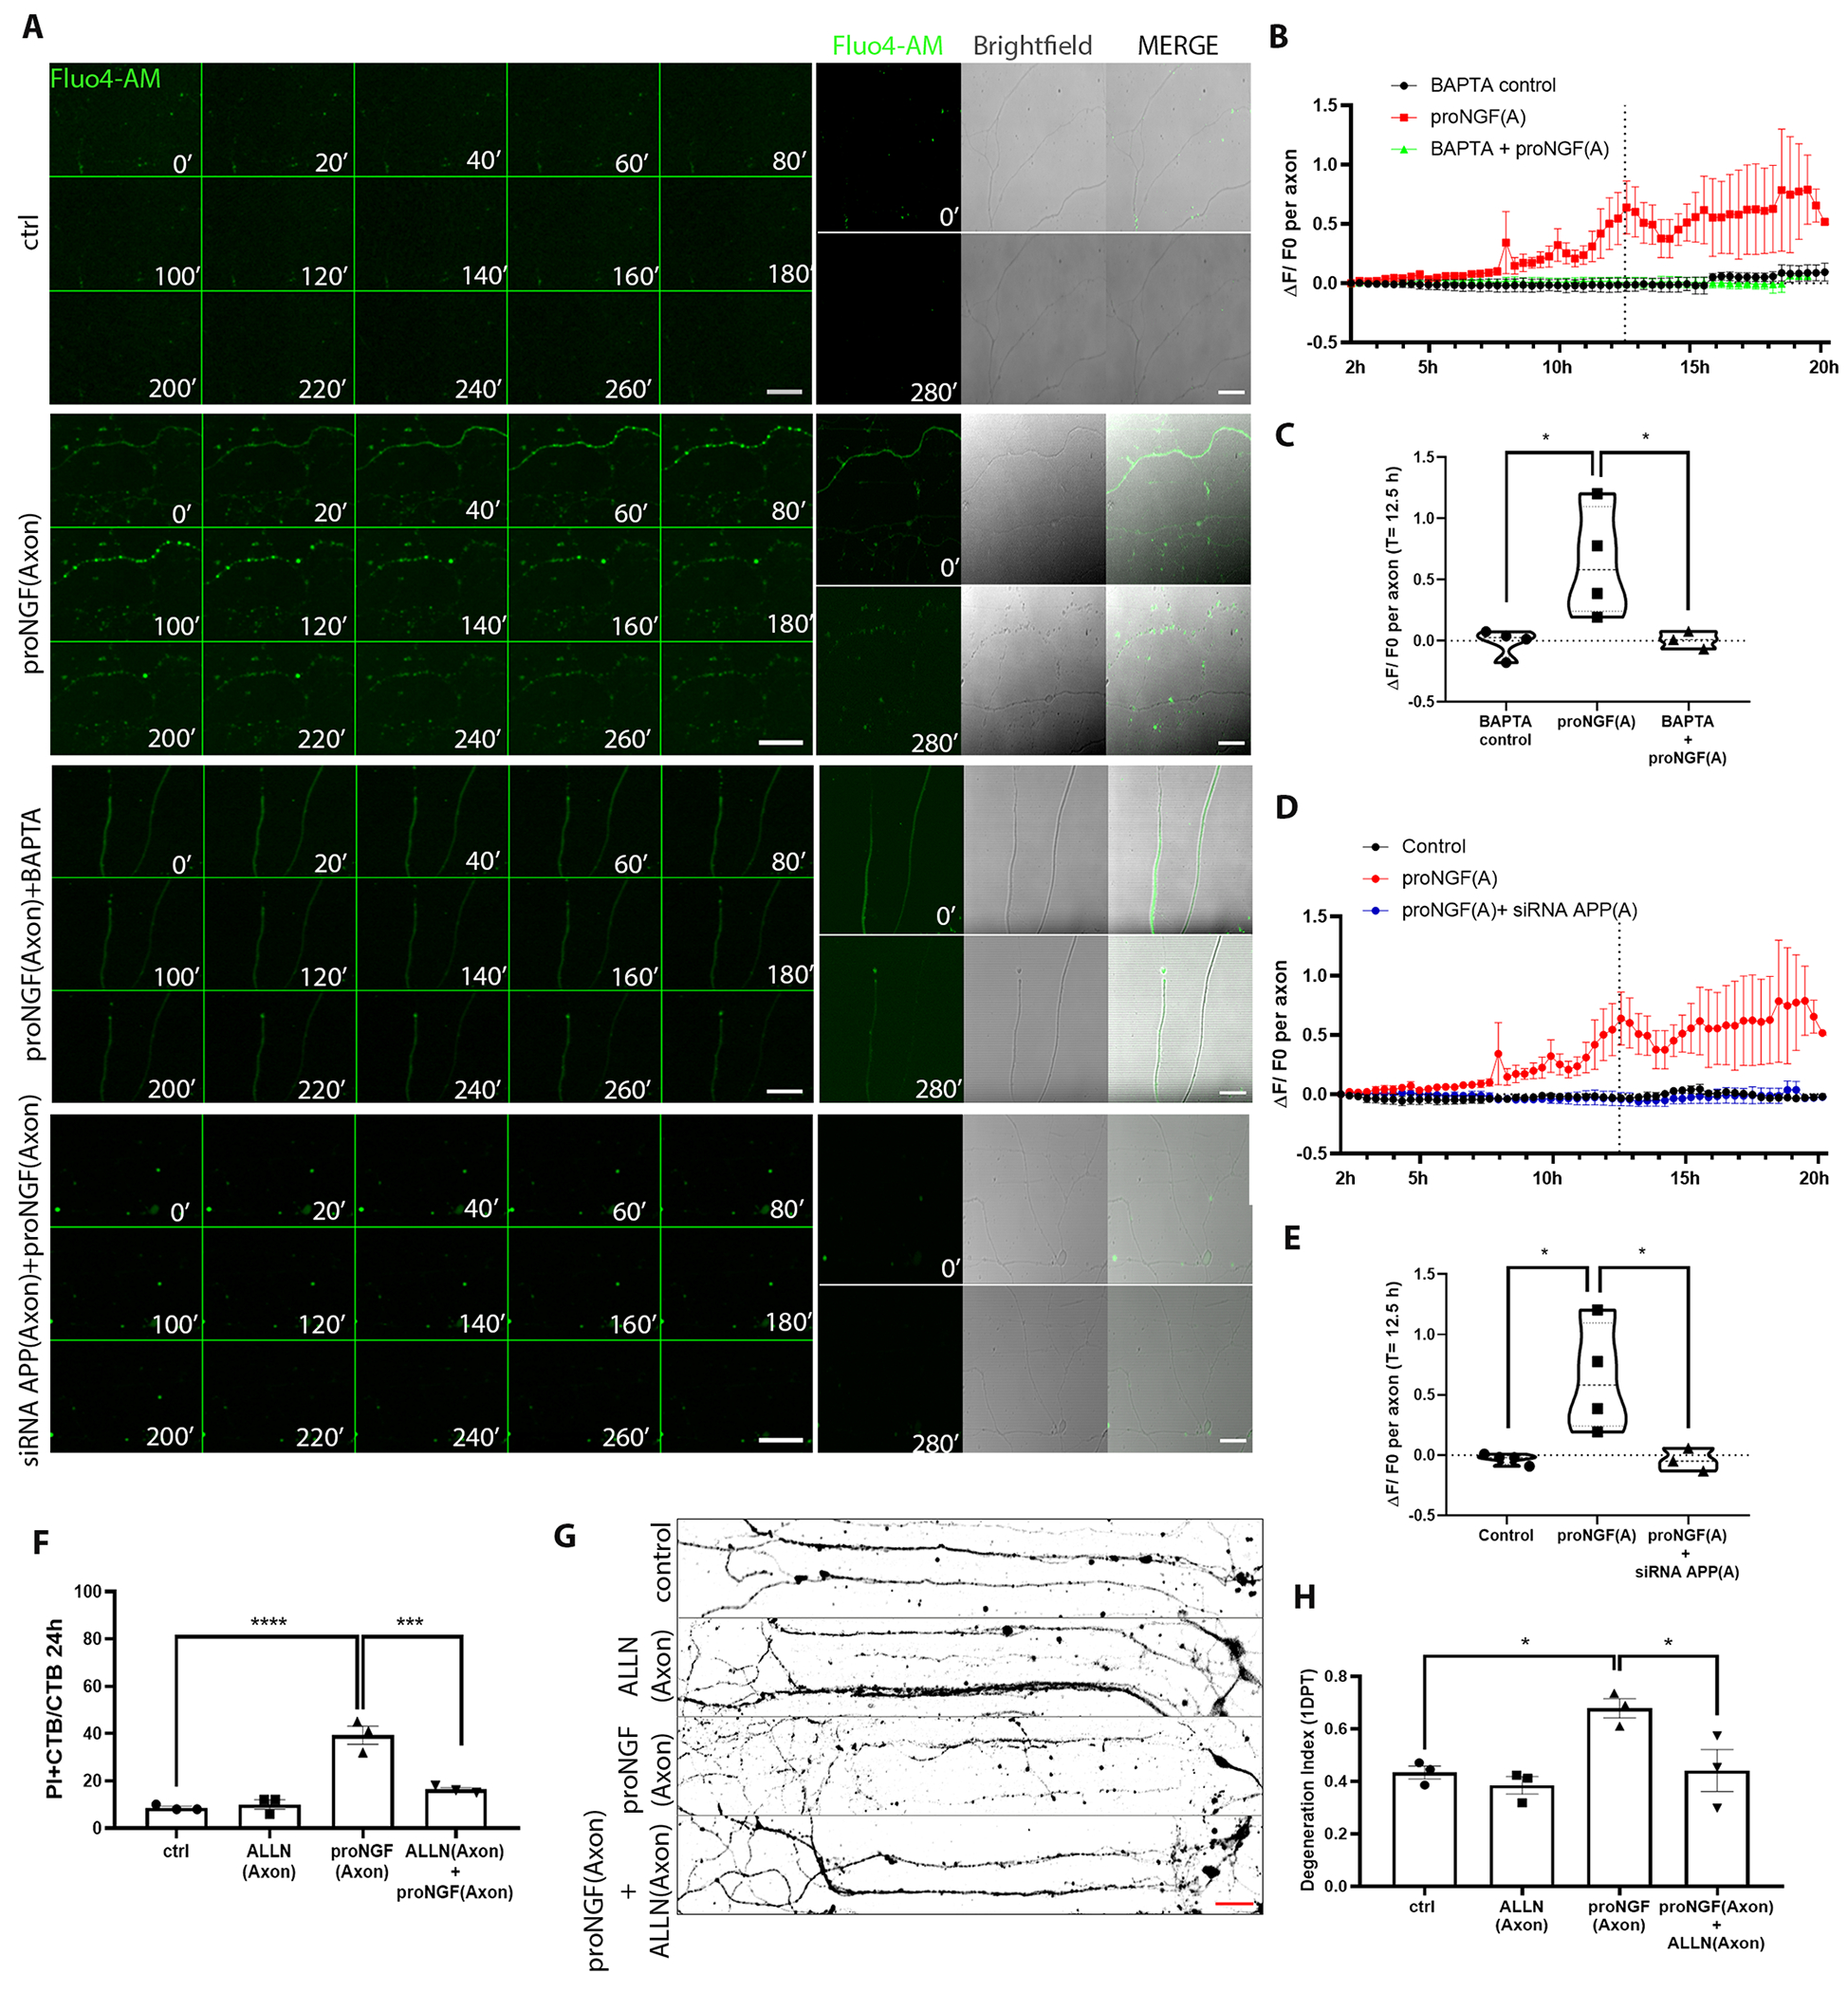
Figure 8. ProNGF-induced BFCN axon degeneration involves APP mediated Ca2+.

(A) Representative images of BFCN axons loaded with 5 μM Fluo4-AM (green) in control untreated axons, treated as indicated at the axon, from 10 to 14.6 hours (280 mins, 20-min lapses) after treatment, representative of 3 or 4 independent experiments. Corresponding axon images with Fluo4-AM and Brightfield at 0mins and 280mins. Scale bar = 50 μm, 40X. (B to E) Time series of the change in Fluo4-AM intensity (ΔF/F0) 2 hours after the indicated pretreatment, at the axon, and comparison of ΔF/F0 between treatments at 12.5 hours. Data are from n= 3 or 4 independent experiments, each with an analysis of at least 5 axons per treatment. ProNGF data sets are the same, for comparison. *p < 0.05 by one-way ANOVA with Tukey’s multiple comparison tests. (F) Quantification of dying BFCNs (PI+CTB/CTB) after 24 hours axonal treatment with proNGF with or without ALLN in the axons, analyzed by live imaging. Data are mean ± SEM, n= 3 independent experiments and analysis of at least 50 cells per treatment. ****p < 0.0001, ***p < 0.001 by one-way ANOVA with Tukey’s multiple comparison tests. (G and H) Binary images of Tuj1-immunostained BFCNs treated as indicated, with quantification of axon fragmentation, represented as a degeneration index. Scale bar = 50 μm, 20X. Data are mean ± SEM from n = 3 independent experiments and analysis of at least 50 cells per treatment. *p < 0.05 by one-way ANOVA with Tukey’s multiple comparison tests.
