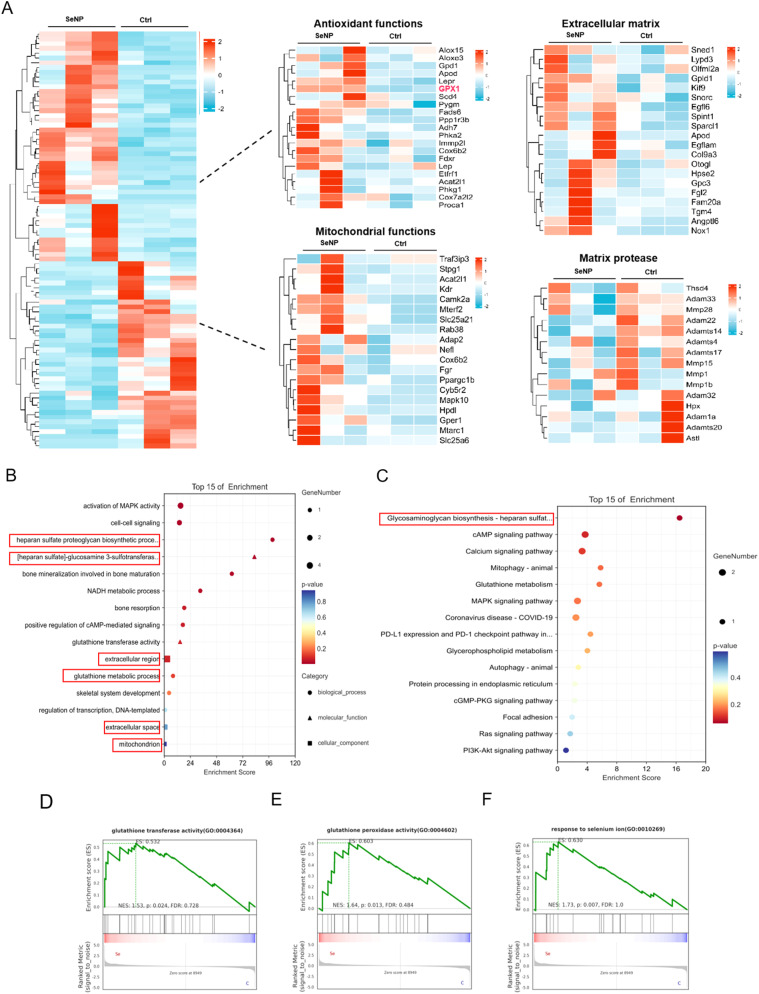
Fig. 5.
RNA sequencing analysis of NPCs with SeNPs intervention. A Heatmap of differentially expressed gene between control group and SeNPs intervention group. B GO enrichment analysis of biological processes and cellular component illustrated the count of the up- and down-regulated genes (indicated by the lines). C KEGG analysis revealed the up and down-regulated signaling pathways in NPCs. D, E, F GSEA enrichment analysis of glutathione transferase activity (p = 0.0024), glutathione peroxidase activity (p = 0.013), and response to selenium ion (p = 0.007) between the control and SeNPs groups

