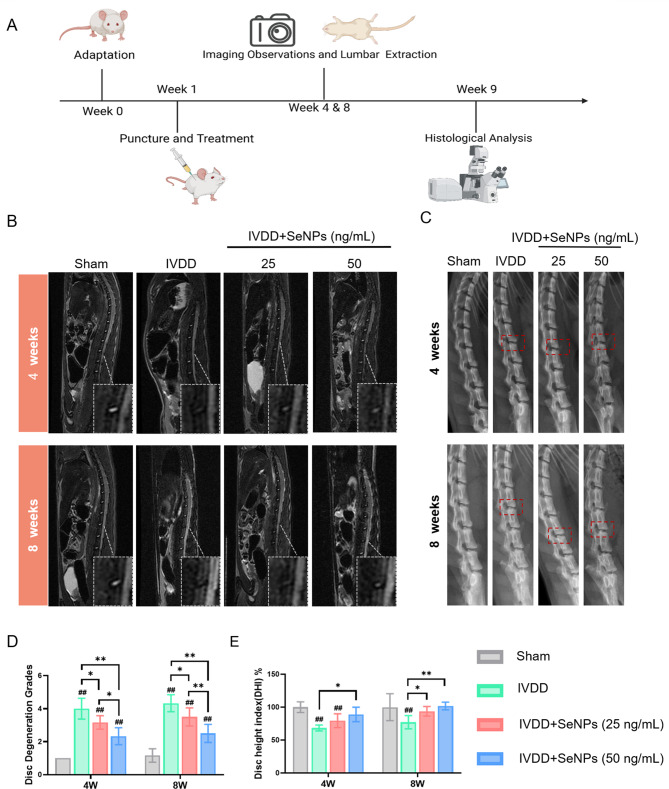
Fig. 8.
Establishment of lumbar degenerative model in rats and imaging results of animal experiments. A Schematic diagram of the in vivo experiment in rats. B Representative MRI images of needing and treated sites in rat lumbar 4 and 8 weeks after surgery. C Representative X-ray images of needing and treated sites in rat lumbar 4 and 8 weeks after surgery. D Quantification of the optical density values of nucleus pulposus in rats. E Quantification of disc height in rats. Statistically significant differences are indicated by # where P < 0.05 or ## where P < 0.01 compared with the control group; * where P < 0.05 or ** where P < 0.01 between the indicated group

