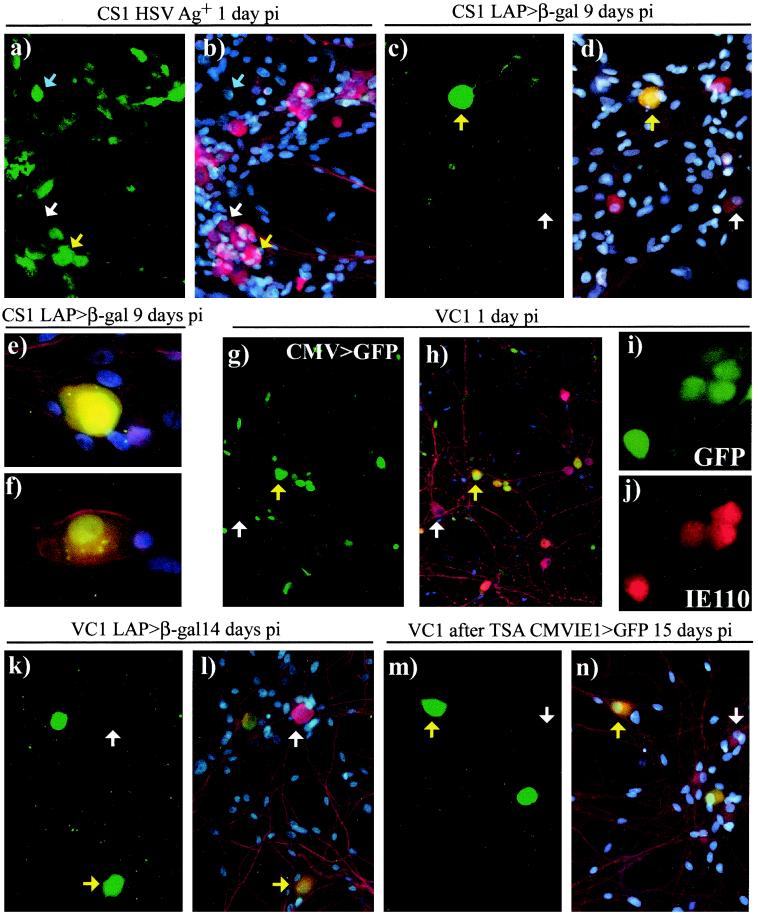
FIG. 3.
Representative examples of neuronal cultures infected with 5 × 10⁵ PFU of either CS1 (a to f) or VC1 (g, h, j to m) per well or 3 × 10⁵ PFU of VC1 (i, j) per well. Fixed cultures were stained by dual (a to f, k, l) or single (g to k, m, n) immunofluorescence to detect expression of viral gene products (green; also see panel h) and/or β-tub (red). Cultures were counterstained with DAPI to show cell nuclei (blue) and were visualized via fluorescence by using either the FITC filter to show FITC (a, c, k) and GFP (g, i, m) or the triple band-pass filter to allow covisualization of DAPI, Cy3 with FITC (b, d to f, k), or GFP signals (h, m). Examples indicated are HSV Ag+, GFP+, or β-gal+ neurons (yellow arrows); HSV Ag+ nonneuronal cells (blue arrows); or neurons in which viral gene products are not detected (white arrows). At day 1 p.i., HSV Ag expression from CS1 (a, b) and CMV IE1 promoter-driven GFP expression from VC1 (k, l) or IE110 (i, j) were detected in neurons and nonneuronal cells. LAP-driven β-gal expression was detected in a proportion of neurons 9 days p.i. with CS1 (c to f) or 14 days p.i. with VC1 (k, l), and higher magnifications show examples of the intense (e) or average (f) β-gal staining obtained. Addition of 660 nM TSA to VC1-infected cultures 14 days p.i. resulted in detection of GFP expression in some neurons 24 h later (m, n).

