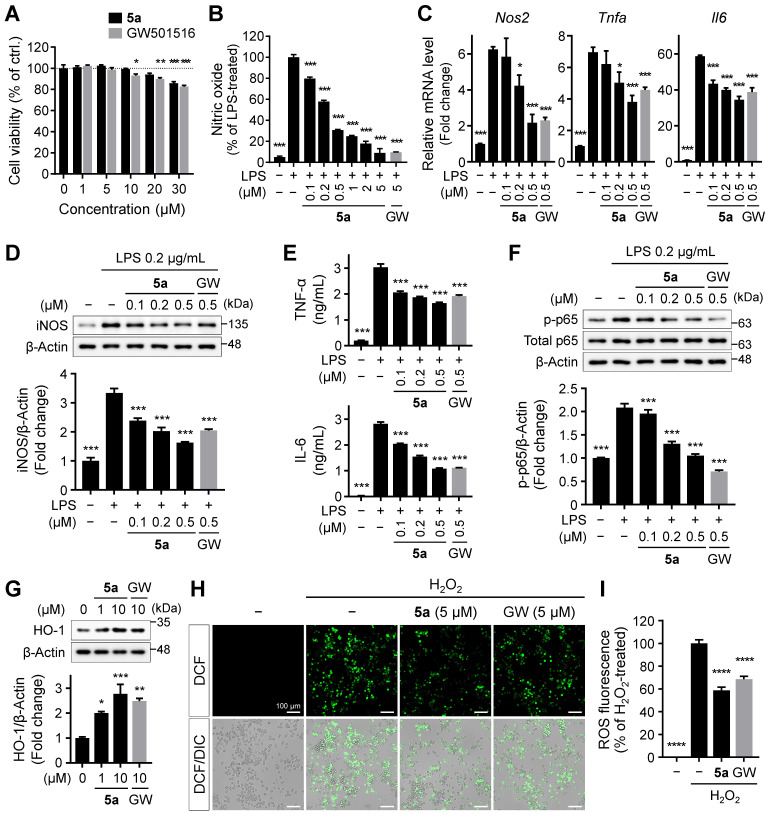
Figure 3.
5a reduces LPS-induced inflammatory responses in BV-2 microglia. (A) Viability of BV-2 microglial cells after treatment with 5a or GW501516 for 24 h. *P < 0.05, **P < 0.01 and ***P < 0.001 versus vehicle-treated control (one-way ANOVA with Dunnett's test). (B) Nitrite levels in the culture medium of BV-2 cells pretreated with 5a or GW501516 for 3 h followed by LPS (0.2 μg/mL) treatment for 24 h. (C) qRT-PCR analysis of relative mRNA expression of Nos2 (iNos), Tnfa, and Il6 in BV-2 cells pretreated with 5a or GW501516 for 12 h followed by LPS treatment for 3 h. Hprt mRNA levels were used to normalize the expression of each gene. (D) Western blot analysis for iNOS in BV-2 cells pretreated with 5a or GW501516 for 1 h followed by LPS treatment for 24 h. (E) TNF-α and IL-6 levels in the culture medium of BV-2 cells pretreated with 5a or GW501516 for 9 h followed by LPS treatment for 18 h. (F) Western blot analysis for phospho-NF-κB p65 (Ser536) and NF-κB p65 in BV-2 cells pretreated with 5a or GW501516 for 6 h followed by LPS treatment for 1 h. *P < 0.05 and ***P < 0.001 versus LPS-treated control (one-way ANOVA with Dunnett's test). (G) Western blot analysis for HO-1 in BV-2 cells after treatment with 5a or GW501516 for 48 h. *P < 0.05, **P < 0.01 and ***P < 0.001 versus vehicle-treated control (one-way ANOVA with Dunnett's test). (H-I) Intracellular ROS levels assessed via DCFH-DA staining. BV-2 cells were treated with 5a (5 μM) or GW501516 (5 μM) for 24 h followed by H2O2 (200 μM) for 20 min to induce oxidative stress. (H) Representative fluorescence images of DCFH-DA stained BV-2 cells. (I) Quantification of DCF fluorescence intensity in (H). ****P < 0.0001 versus H2O2-treated control (one-way ANOVA with Dunnett's test). Data are presented as mean ± SEM. GW: GW501516.

