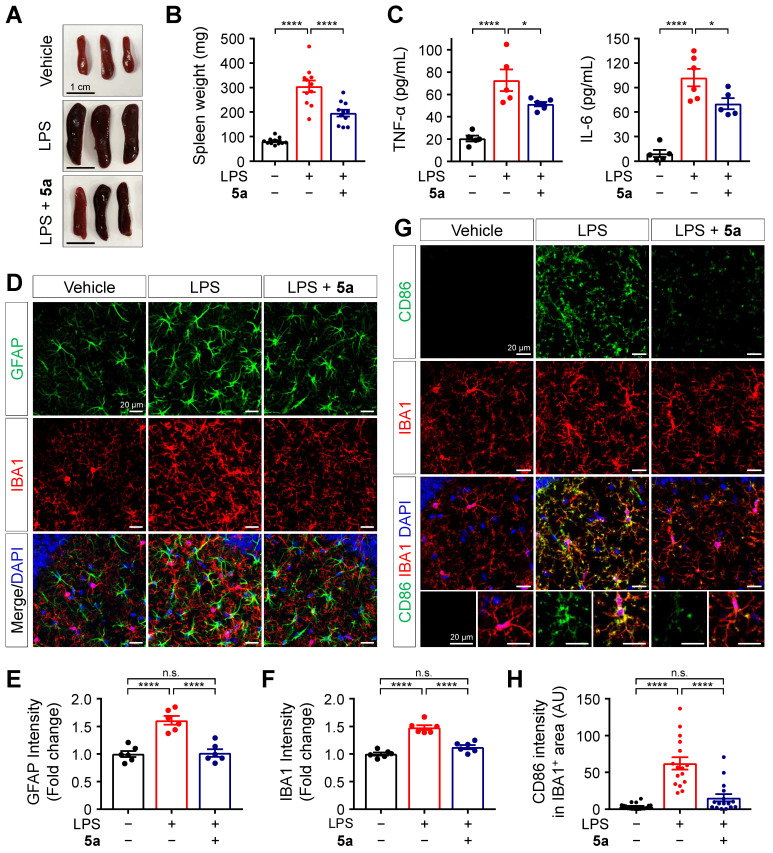
Figure 5.
5a prevents LPS-induced inflammation and glial activation. (A-B) Representative images (A) and mean weight (B) of dissected spleens from vehicle- and LPS-treated mice (0.3 mg/kg/day for 7 days, i.p.) with or without oral administrations of 5a (30 mg/kg/day for 10 days) (n = 11 mice per group). (C) Plasma cytokine levels in vehicle- and LPS-treated mice with or without oral administrations of 5a (n = 5-6 mice per group). *P < 0.05, and ****P < 0.0001 (one-way ANOVA with Dunnett's test). (D) Representative immunofluorescence images showing GFAP (green) and IBA1 (red) in CA1 region of hippocampus. (E-F) Quantification of immunoreactivity for GFAP (E) and IBA1 (F) in (D) (n = 6 brain sections from six mice per group). (G) Representative immunofluorescence images showing CD86 (green) and IBA1 (red) in the CA1 hippocampal region. (H) Mean intensity of CD86 in IBA1-positive areas (n = 16-18 brain sections from six mice per group). ****P < 0.0001; n.s., not significant (one-way ANOVA with Tukey's test). Data are presented as mean ± SEM.

