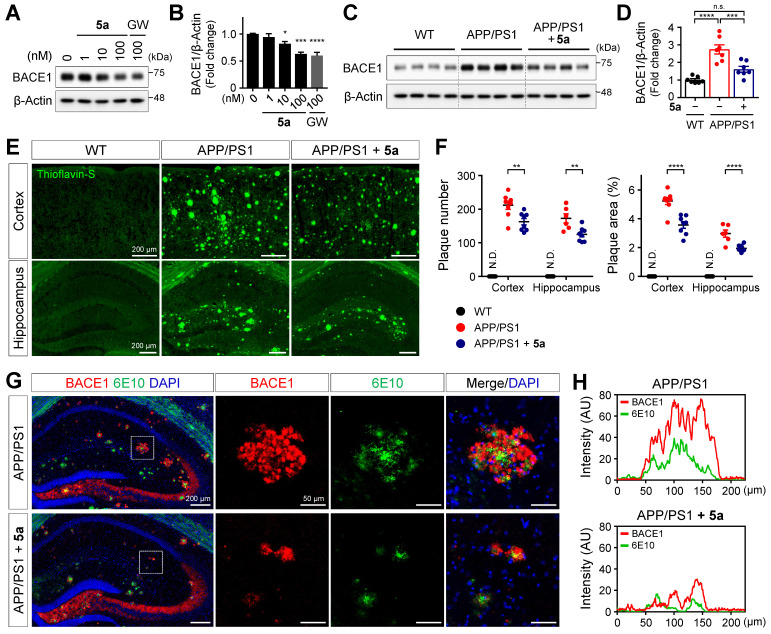
Figure 7.
5a reduces BACE1 expression and amyloid burden in APP/PS1 mice. (A-B) Western blot analysis for BACE1 in SH-SY5Y cells after treatment with 5a or GW501516 for 24 h. *P < 0.05, ***P < 0.001 and ****P < 0.0001 versus vehicle-treated control (one-way ANOVA with Dunnett's test). (C-D) Western blot analysis for BACE1 in cortical homogenates of WT and APP/PS1 mice treated with vehicle or 5a (n = 7 mice per group). (E) Thioflavin-S staining for Aβ plaques in the cortex and hippocampus of WT and APP/PS1 mice treated with vehicle or 5a (n = 8 brain sections from four mice per group). (F) The number (left) and area (right) of thioflavin-S-stained Aβ plaques in the cortex and hippocampus. **P < 0.01, ***P < 0.001 and ****P < 0.0001; n.s., not significant (one-way ANOVA with Tukey's test). (G) Immunoreactivity of BACE1 (red) around 6E10 (green)-positive amyloid plaque in the hippocampus of APP/PS1 mice treated with vehicle or 5a (n = 4 brain sections from four mice per group). Right, higher-magnification images of the dotted boxed area in the hippocampus. (H) Intensity profile plots showing colocalization of BACE1 with 6E10-positive amyloid plaques. Fluorescence intensity for BACE1 and 6E10 in APP/PS1 mice treated with vehicle (top) or 5a (bottom) were measured using the magnified images in (G). Data are presented as mean ± SEM. N.D.: not detected; AU: arbitrary unit.

