Fig. 1.
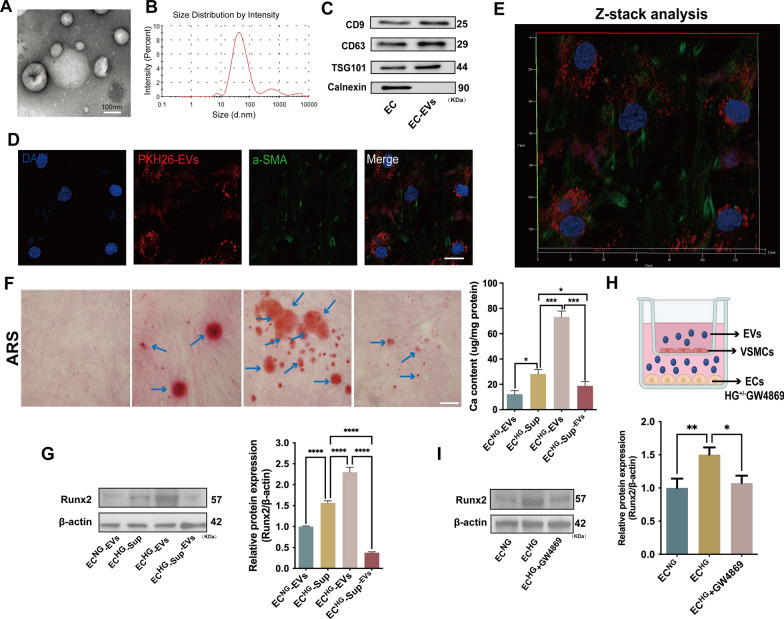
EVs derived from HG-stimulated ECs exacerbated VSMC calcification. A Representative morphological analysis of EC-EVs by TEM (Scale bar = 100 nm). B Diameter distribution of EC-EVs by NTA; C the expression of CD9, CD63, TSG101 and Calnexin were detected by WB. D–E Laser scanning confocal microscope and Z-stack analysis showed that PKH26-labeled EC-EVs would be taken up by VSMCs and mainly located at the cytoplasm of VSMCs (PKH26 in red, DAPI in blue, and a-SMA in green) (scale bar = 20 μm). F ARS staining and quantification of the calcium content in VSMCs treated with ECNG-EVs, ECHG-Sup, ECHG-EVs, ECHG-Sup−EVs, respectively. The blue arrows indicate mineralized nodules in VSMCs (Scale bar = 100 μm). G The expression of Runx2 protein was determined by WB in VSMCs incubated with ECNG-EVs, ECHG-Sup, ECHG-EVs, ECHG-Sup−EVs, respectively. H ECs were pre-treated with HG and co-cultured with VSMCs in the trans-well units, either with or without the addition of GW4869; I the expression of Runx2 protein was measured by using WB. One-way ANOVA with Tukey’s multiple comparisons test (F, G, I) was used. Three independent experiments were performed, and the representative data were shown. Data were shown as mean ± SD. ****p < 0.0001, ***p < 0.001, **p < 0.005, *p < 0.05. EVs, extracellular vesicles; TEM, transmission electron micrographs; NTA, nanoparticle tracking analysis; WB, western blot; ECNG-EVs, EVs derived from normal-glucose induced ECs; ECHG-EVs, EVs derived from high-glucose induced ECs; ECHG-Sup, supernatant derived from high-glucose induced ECs; ECHG-Sup−EVs, supernatant derived from ECHG with deprivation of EVs; ARS: alizarin red s

