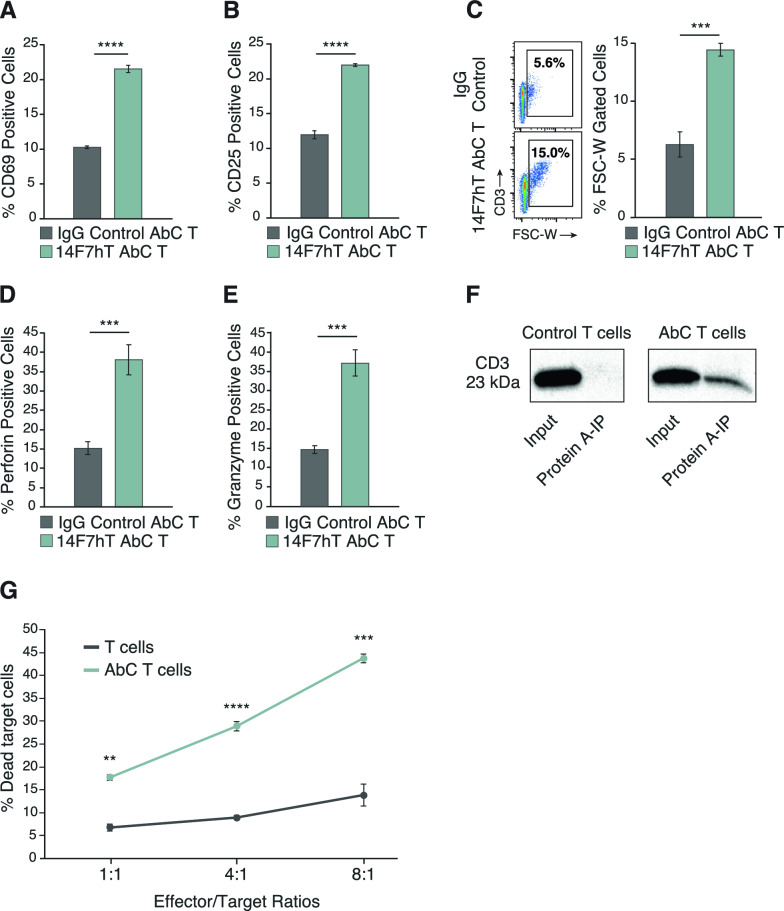
Fig. 4.
Increase of activation markers and specific killing after interaction of unactivated AbC T cells and target cells. Expression of CD69 (A), CD25 (B), forward scatter profile (C), perforin (D) and granzyme (E) on IgG control AbC T cells or 14F7hT AbC T cells was measured by flow cytometry after co-culturing with antigen-expressing L1210 cells at 4:1 E/T ratio. F Control and AbC T cells were evaluated via co-immunoprecipitation for 14F7hT linkage to CD3. The input and eluted materials were evaluated by Western blot. G T or AbC T cells were cultured with antigen-expressing L1210 cells for 16 h at different E/T ratios. Cells were stained with 7-AAD and analyzed by flow cytometry with target cells analyzed for their death rates. Flow cytometry data is representative of 3 independent experiments with T cells sourced from 3 different donors. Data represents the mean ± SD (n = 3). (Student’s t-test, **p < 0.01, ***p < 0.001 and ****p < 0.0001, ns not significant)

