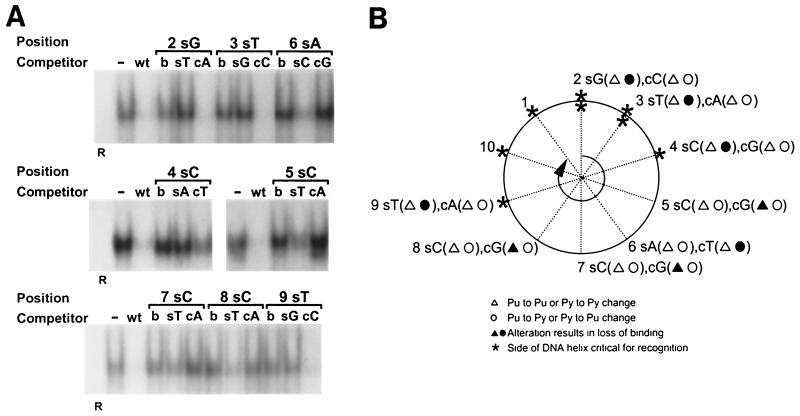
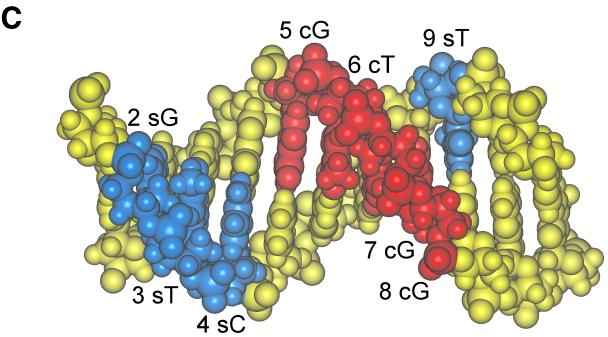
FIG. 10.
EMSA to measure recognition of heteroduplexes. (A) Heteroduplex oligonucleotides containing single mismatched base pairs at positions 2 through 9 were created by annealing a wild-type 7–2Eext oligonucleotide to complementary oligonucleotides containing single nucleotide substitutions. For positions 2 through 9, 60-fold molar excesses of heteroduplex oligonucleotides with a mutation on the 5′-to-3′ sense strand (s) or a mutation of the 3′-to-5′ complementary strand (c) were compared for their ability to compete for binding with truncated OBPH7 against oligonucleotides containing the mutation on both strands (b). −, no competitor; WT, wild-type 7–2E is the competitor; R, negative control protein lysate. (B) Helical wheel representation of heteroduplex analysis. The 9-bp OBP-2 core sequence is arranged on a helical wheel to approximate the 10.4 base residues per turn of a B-form DNA helix. For each position, two heteroduplex oligonucleotides were synthesized with changes on the sense strand (first set of parentheses) and two were made with changes on the complementary strand (second set of parentheses). Purine-to-purine and pyrimidine-to-pyrimidine changes are indicated by triangles. Purine-to-pyrimidine and pyrimidine-to-purine changes are indicated as circles. Solid symbols indicate that strand-specific alteration is responsible for loss of recognition at that position in the core sequence. Asterisks indicate the side of the DNA helix that is critical for recognition; thus, a change on the complementary strand that affects recognition is indicated by an asterisk on the opposite side of the helix (e.g., the T at position 6). (C) A B-form DNA model of the OBP-2 site, CGTCCACCTCA, was produced using Insight II, Release 2000 (Molecular Simulations, Incorporated, San Diego, Calif.). Labeled positions indicate strand mismatches that resulted in the loss of recognition by OBPH7.


