
FIGURE 2.
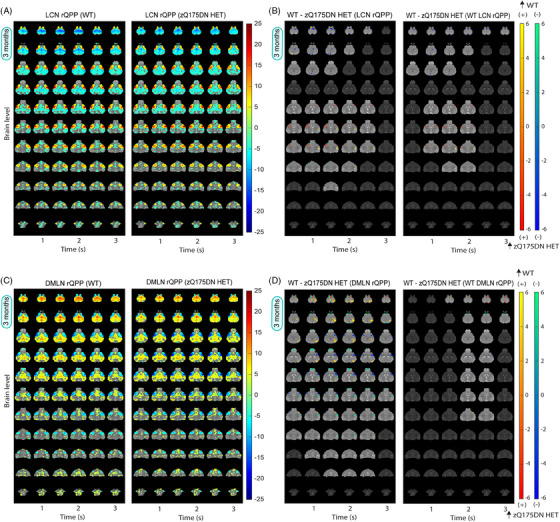
Group DMLN and LCN rQPPs in WT and zQ175DN HET and spatial activation differences at 3 months of age. (A, C) One‐sample T‐maps of LCN (A) and DMLN (C) rQPPs in both groups where significantly activated (red‐yellow) and deactivated (green‐blue) voxels as compared to the mean BOLD signal are shown (two‐tailed one‐sample T‐test, FDR, p < 0.05). (B, D) Two‐sample T‐test maps (two‐tailed, FDR, p < 0.05) of (1) between‐group differences for LCN and DMLN rQPP of each group (left panels) and (2) differences between WT LCN and WT DMLN rQPPs and their projections in the zQ175DN HET (right panels). Red‐yellow and blue‐green colour bars display differences in voxels that are positively and negatively activated, respectively.