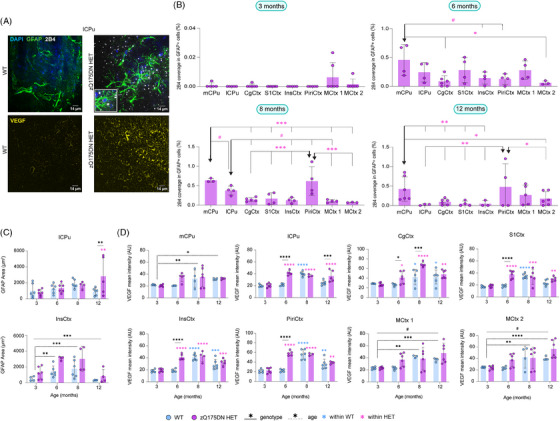
FIGURE 8.

mHTT deposition in astrocytes and VEGF expression in the zQ175DN HET mice across ages. Representative immunofluorescence images of (A, top) mHTT (2B4, white), astrocytes (GFAP, green) and nuclei (DAPI, blue) at 8 months of age and (A, bottom) an angiogenesis marker (VEGF, yellow) at 6 months of age for WT and zQ175DN HET; (B) deposition of 2B4 in GFAP+ cells in zQ175DN HET mice across regions at 3, 6, 8 and 12 months of age (mean ± SD, two‐way ANOVA, p < 0.05); genotypic difference in (C) thresholded GFAP+ area relative to FOV and in (D) VEGF intensity in FOV (mean ± SD, two‐way ANOVA, p < 0.05); post hoc comparisons represented as differences to a specific region (↓), FDR corrected, *p ≤ 0.05, **p ≤ 0.01, ***p ≤ 0.001, ****p ≤ 0.0001, # p ≤ .1; AU arbitrary unit, mCPu medial caudate putamen, lCPu lateral caudate putamen, PiriCtx piriform cortex, InsCtx insular cortex, MCtx 1 motor cortex 1, MCtx 2 motor cortex 2, S1Ctx somatosensory cortex 1, CgCtx cingulate cortex.
