FIGURE 2.

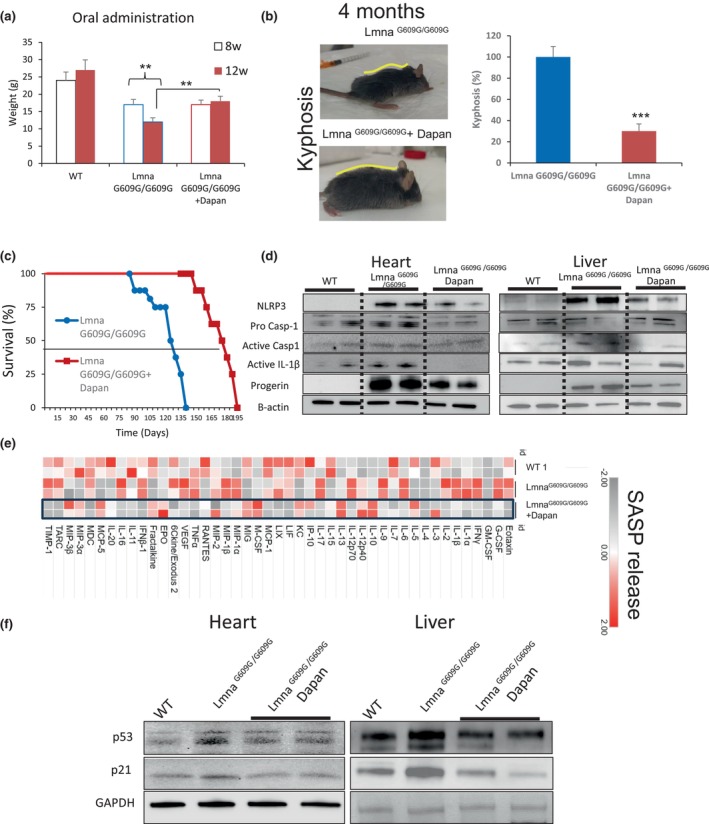
NLRP3 Inhibition by dapansutrile ameliorates LmnaG609G/G609G mice progeroid phenotypes. (a) Body weights of the indicated groups at 8 and 12 weeks after treatments. (b) Kyphosis percentage of untreated (n = 6 males) and dapansutrile‐treated (n = 6 males) LmnaG609G/G609G mice. Image show two representative animal after 4 months of treatment. (c) Kaplan–Meier graph showing a significant increase in the medium and maximum lifespan in treated mice compared with LmnaG609G/G609G mice. N = 8 per group. (d) Western blot analysis showing representative blots of NLRP3, total and active caspase 1, active IL‐1β, progerin and β‐Actin levels in heart and liver tissues from wild‐type, LmnaG609G/G609G and dapansutrile‐treated LmnaG609G/G609G mice. n = 5 mice per group. Densitometry in Figure S5. (e) A heat map depicting the expression of 44 mouse cytokines in the serum of WT, LmnaG609G/G609G, and dapansutrile‐treated LmnaG609G/G609G mice. (f) Western blot analysis showing representative blots of p53, p21 and β‐Actin levels in heart and liver from wild‐type, LmnaG609G/G609G and dapansutrile‐treated LmnaG609G/G609G mice. Densitometry in Figure S6. n = 5 mice per group. ***p < 0.001, **p < 0.005.
