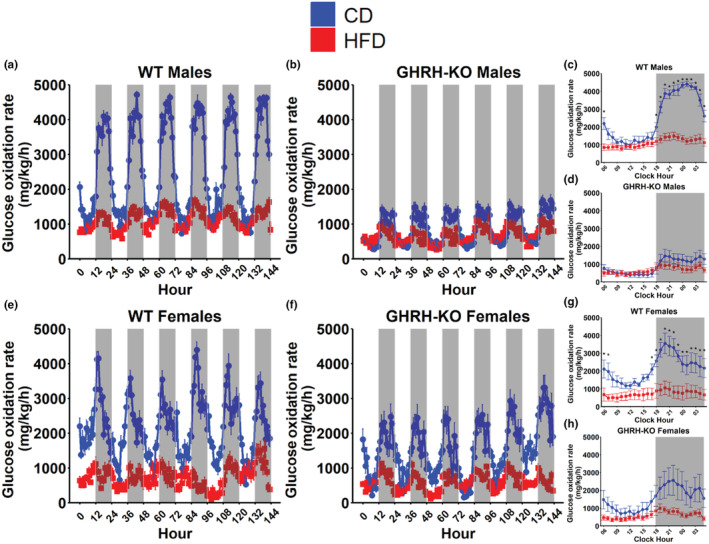
FIGURE 4.

High‐fat diet induced changes in glucose oxidation rate. Body weight normalized glucose oxidation rate, calculated as 4.57 × VCO2–3.23 × VO2, for male wild‐type (WT) (a) and male growth hormone‐releasing hormone‐knockout (GHRH‐KO) (b) mice over the 6‐day indirect calorimetry data collection period. Pairwise comparisons for mean bodyweight normalized glucose oxidation rate at each hour in a 24‐h day in WT males (c) and GHRH‐KO males (d). Bodyweight normalized glucose oxidation rate for female WT (e) and female GHRH‐KO (f) mice over the 6‐day indirect calorimetry data collection period. Pairwise comparisons for mean bodyweight normalized glucose oxidation rate at each hour in a 24‐h day in WT females (g) and GHRH‐KO females (h). Shaded regions indicate dark cycles. Data presented as mean ± SEM. Statistical significance assessed by repeated measure two‐way ANOVA; *p < 0.05 as determined by pairwise comparisons with the Benjamini–Hochberg false discovery rate correction applied. N = 4–9 (males), N = 5–6 (females).
