
FIGURE 3.
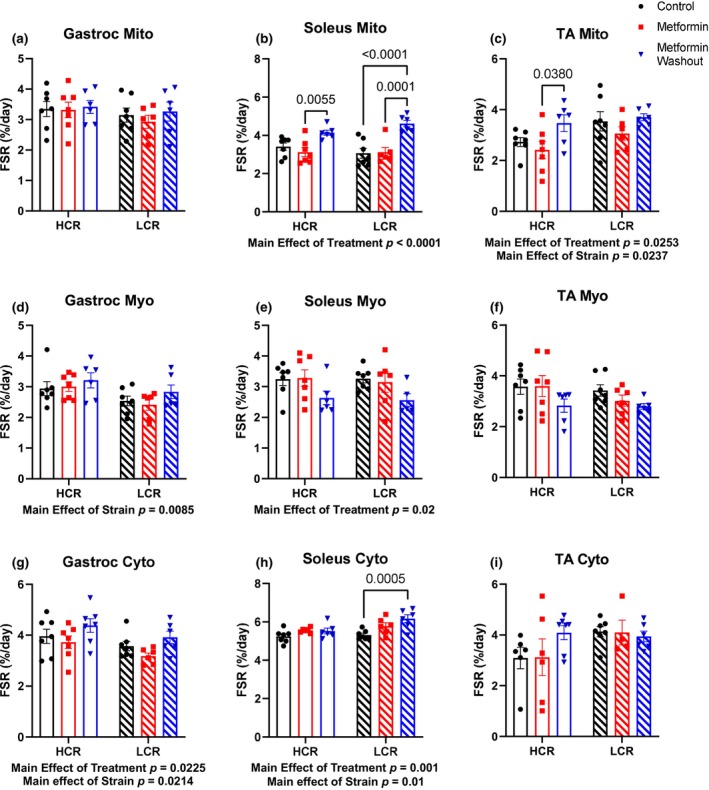
Determination of the fractional synthesis rates in (a–c), mitochondrial (Mito), (d–f), myofibrillar (Myo) fractions, and (g–i) cytosolic (Cyto) of the gastrocnemius (gastroc), soleus, and tibialis anterior (TA) muscles. Data were analyzed by two‐way ANOVA (group × treatment) and are represented as mean ± SEM from 4 to 7 rats per group.