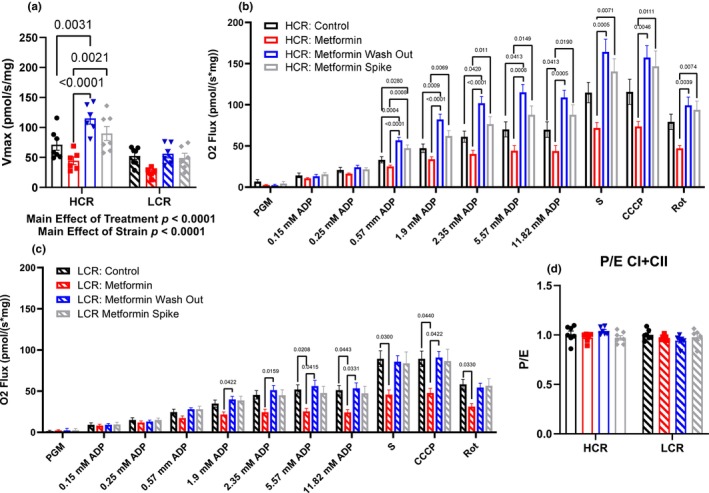
FIGURE 6.

(a) Maximal mitochondrial respiration (V max). Mitochondrial respiration in (b) HCRs and (c) LCRs. The apparent Km of ADP was calculated using Michaelis–Menten kinetics. Data were analyzed by two‐way ANOVA (a and d) or by one‐way ANOVA for each substrate addition (b and c) within each strain. Data are represented as mean ± SEM from 4 to 7 rats per group. HCR, high‐capacity runner; LCR, low‐capacity runner.
