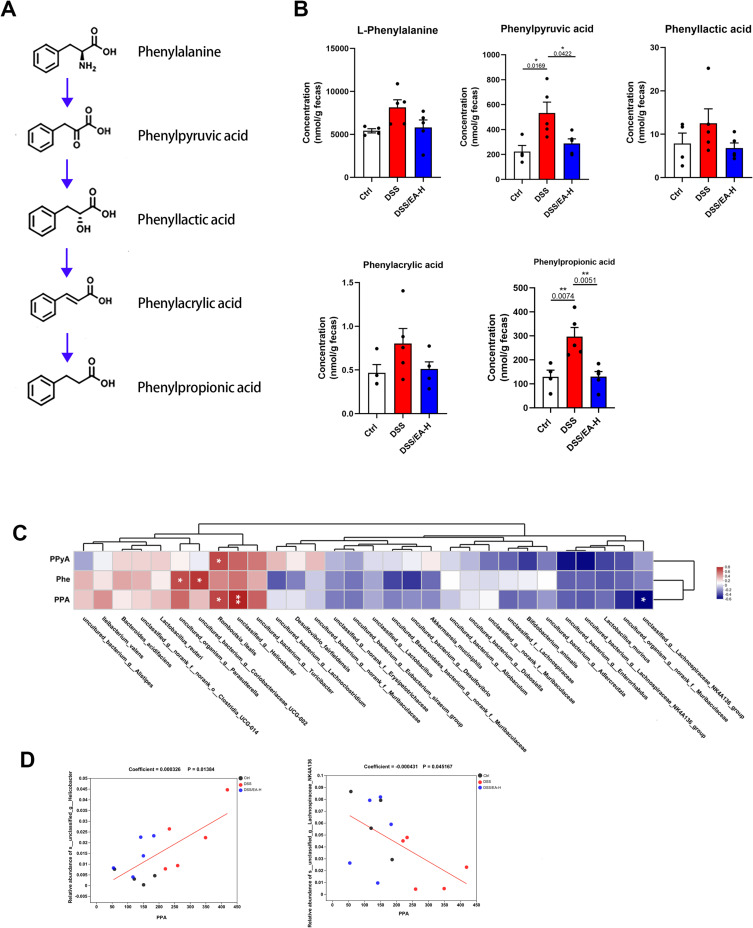
Figure 6.
EA influences the metabolism of phenylalanine in DSS-treated mice. (A) Schematic diagram of Phenylalanine (Phe) metabolism. (B) The concentration of microbial metabolites of Phe in feces. (C) Correlation analysis between gut microbiota and Phe, phenylpyruvic acid (PPyA), and phenylpropionic acid (PPA). (D) MaAsLin analysis of gut microbiota and PPA. Data are expressed as the Mean ± SEM. *P < 0.05, ** P< 0.01; one-way ANOVA with Tukey’s post hoc analysis.

