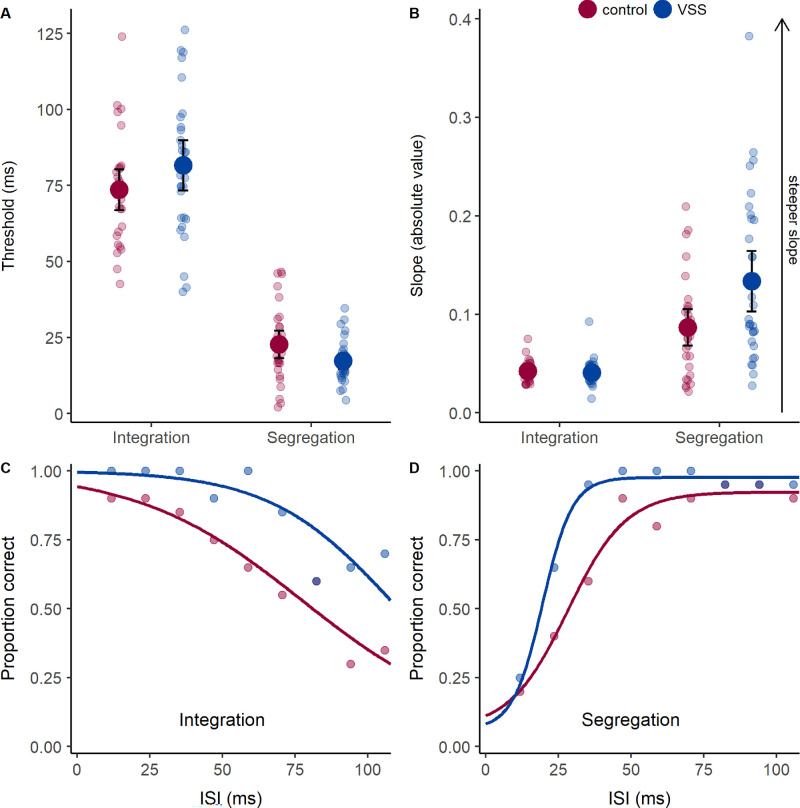
Figure 4.
Performance on the missing-element (integration) and odd-element (segregation) tasks. (A) Thresholds indicate the ISI between images required for integration or segregation with 50% accuracy. A long threshold ISI indicates good integration ability, whereas a short threshold ISI indicates good segregation ability. (B) Slopes, with lower values denoting shallower slopes due to increased response variability that is indicative of greater task difficulty. Group mean (large circles), 95% confidence intervals (error bars), and individual data (small circles) are shown, with controls in red and participants with VSS in blue. (C, D) Example data (circles) and psychometric functions (lines) from a control participant (red) and VSS participant (blue). For segregation (D), note the steeper slope and leftward shift of the psychometric function in the VSS participant.

