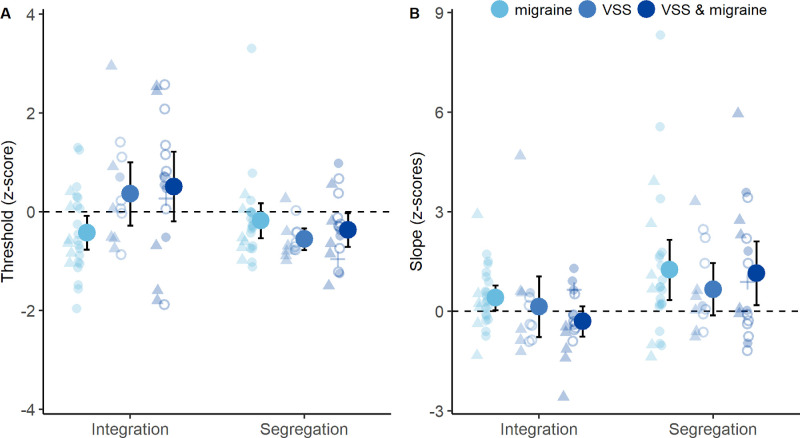
Figure 5.
Influence of migraine on integration and segregation performance. (A) The z-scores for thresholds, referenced to controls. (B) The z-scores for slopes, referenced to controls. Group means (large circles), 95% confidence intervals (error bars), and individual data are shown. Participants with migraine alone are indicated in light blue; VSS alone in mid-blue; and VSS and migraine in dark blue. Individual data symbols indicate participants with afterimages alone (triangles), trailing alone (cross), both trailing and afterimages (unfilled circles), or no palinopsia (filled circles). A z-score of zero indicates that performance was the same as the control group mean. Higher z-scores indicate higher threshold or slope values (positive for greater than control mean, negative for less than control mean).

