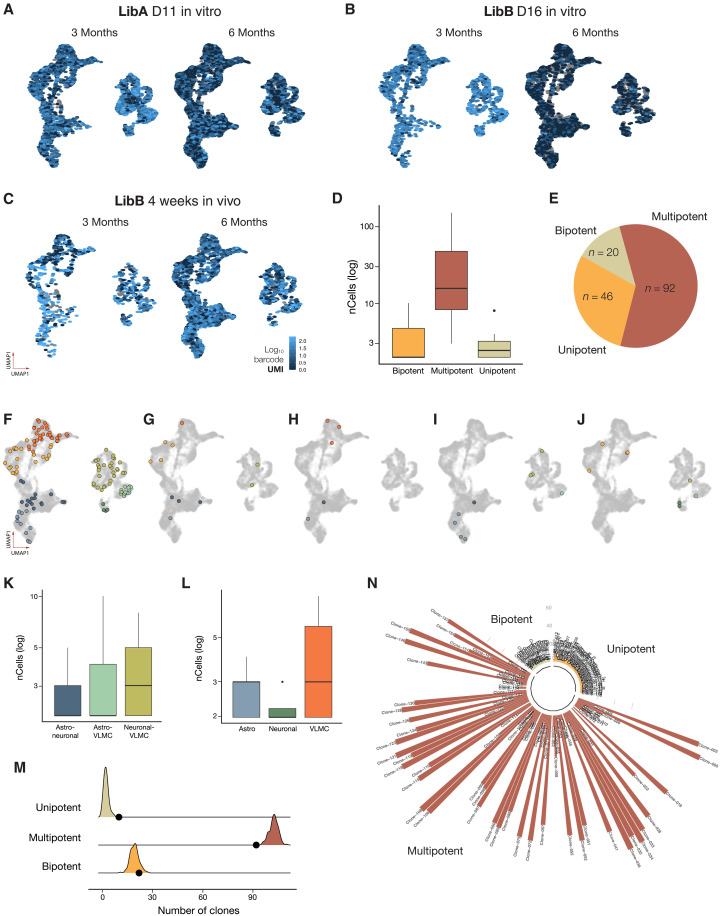
Fig. 3. Clonal dynamics derived from progenitors barcoded at day 11.
(A to C) Expression level of dominant viral barcode derived from LibA and LibB delivered at day 11, day 16, and week 4, respectively (n = 6 rats for LibA and n = 3 for each of LibB day 16 and LibB week 4). (D) Clone size per potency after barcode delivery at day 11. Lower and upper hinges correspond to the first and third quartiles, and the whisker extends from the hinge to the largest value no further than |1.5 * IQR| from the hinge (where IQR is the interquartile range or the distance between the first and third quartiles). (E) Proportion of clone types identified. (F and G) Representative multipotent clones containing all three major cell types. (H to J) Representative clone plots of bipotent clones. (K) Clone sizes of bipotent clone pairs detected after delivery of barcode library at day 11. (L) Clone sizes of unipotent clones detected after delivery of barcode library at day 11. (M) Simulation results when generating 10,000 random clones without any fate bias. Shaded areas indicate result of simulation, and black dots indicate results from the actual data. (N) Manhattan plot of clone sizes for day 11 clones colored by potency.

