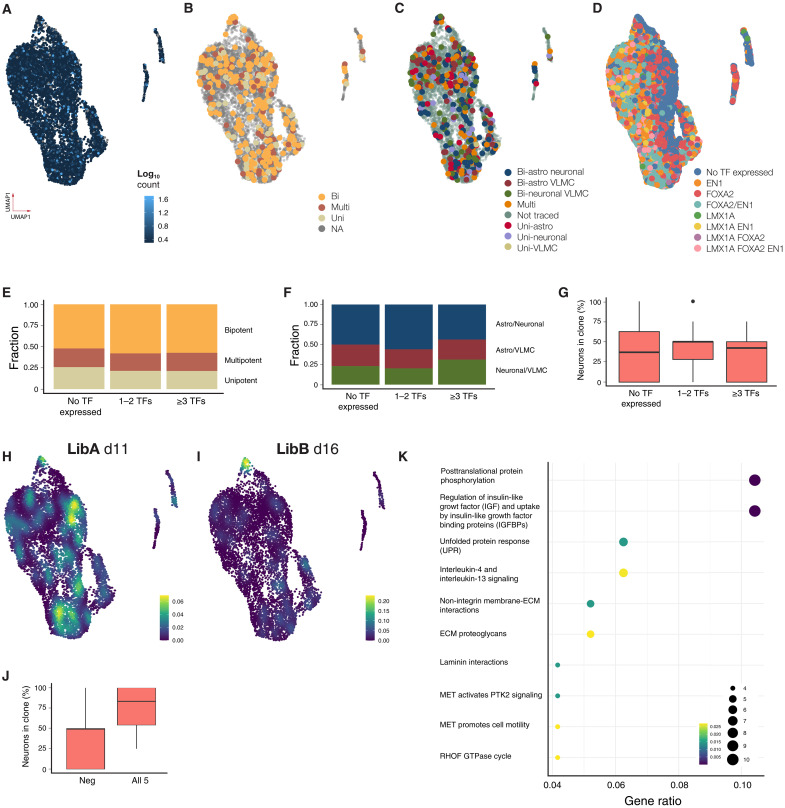
Fig. 5. Clonal capacity and transcriptional profile of day 18 progenitors pretransplantation.
(A to D) UMAP visualization of scRNA-seq from barcoded progenitors (n = 8166, two replicates) colored by barcode transcription level (A), their major clonal (LibA) (B), subclonal capacity (LibA) (C), and VM TF expression (D). NA, not available. (E to G) Fate of progenitors expressing no, one, two, or at least three VM TFs in terms of major clonal fraction (E), bipotent fraction (F), and fraction neurons (G). (H and I) Density plot of progenitors giving rise to neuronal biased clones barcoded at day 11 (H) or day 16 (I). (J) Fraction of neurons in clones expressing top five genes associated with neuronal fate compared to the rest. (K) Pathway analysis of genes associated with neuron biased progenitors at day 16. ECM, extracellular matrix; MET, metanephrine; GTPase, guanosine triphosphatase; PTK2, Protein Tyrosine Kinase 2; RHOF, Ras Homolog Family Member F.

