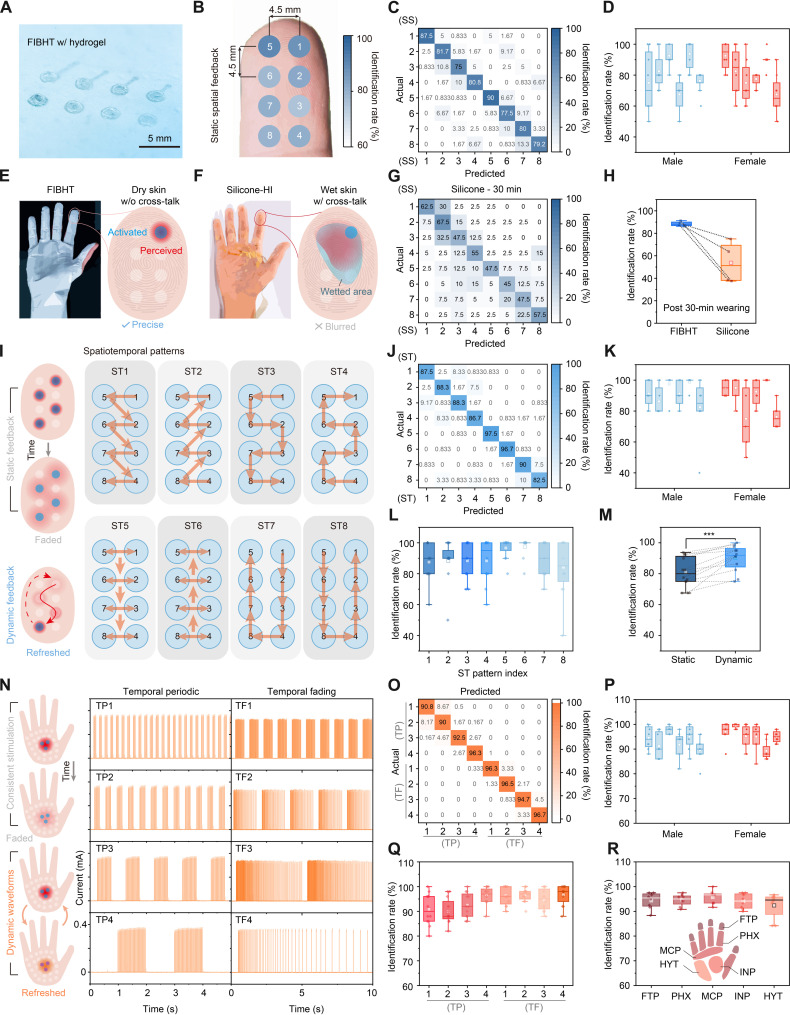
Fig. 4. Dynamic feedback user study.
(A) Optical image of the eight-channel array on FIBHT for fingertip (FTP) feedback test. (B) Overall identification rate distribution on the fingertips. (C) Confusion matrix of the static spatial (SS) testing results. (D) Identification rate distributions of SS testing in each individual. n = 8. (E and F) Schematic illustration of testing in conditions of wearing FIBHT and silicone-HI for 30 min. (G) Confusion matrix of the SS testing results in selected volunteers after wearing silicone-HI for 30 min. (H) Comparison of average identification rates between FIBHT and silicone-HI groups. (I) Eight different spatiotemporal (ST) dynamic patterns. (J) Confusion matrix of the ST testing results. (K) Identification rate distributions of ST testing in each individual. n = 8. (L) Identification rates among ST patterns. n = 12. (M) Comparison of average identification rates between SS and ST tests. n = 12, ***P < 0.001. (N) Eight different temporal dynamic modes (TP/TF). (O) Confusion matrix of the TP/TF testing results. PHX, phalanx; MCP, metacarpophalangeal joint; HYT, hypothenar eminence; INP, inner palm. (P) Identification rate distributions of TP/TF testing in each individual. n = 8. (Q) Identification rates among TP/TF modes. n = 12. (R) Identification rate distributions of TP/TF testing in five regions of the hand. n = 8. For all box plots, square, mean; center line, median; box limits, upper and lower quartiles; whiskers, 1.5× interquartile range; points, outliers.

