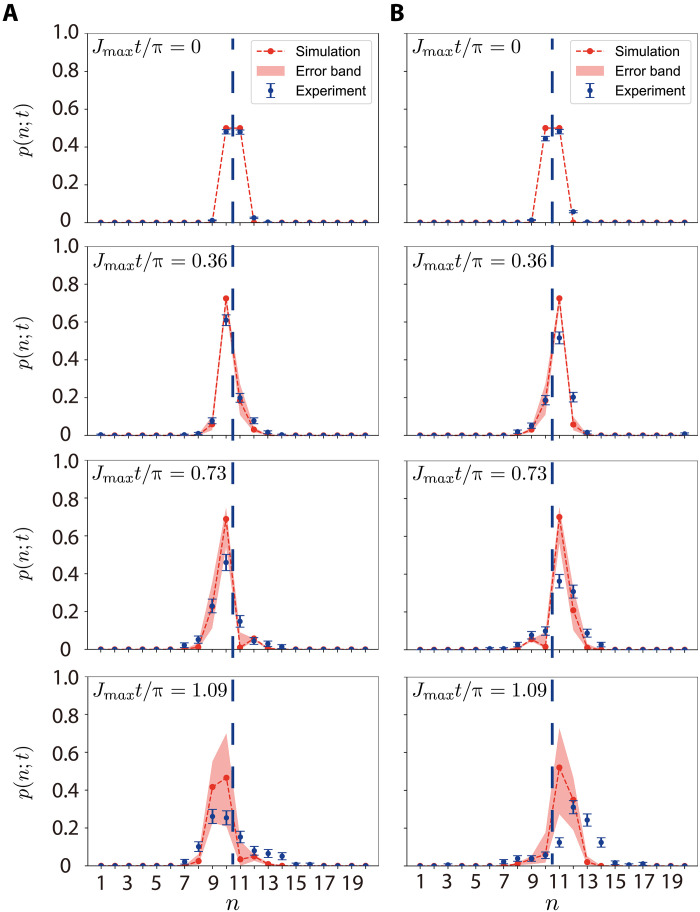
Fig. 4. Directional propagation of a superposed topological defect.
Time evolution of an initial superposed kink with a relative phase (A) π/2 or (B) −π/2 at various times t. Blue dots are experimental data with 1-SD error bars. Red dots are simulated data connected by red dashed lines as the guides to the eye, while the red error band accounts for a shift of ±2π × 15 Hz in the Raman laser frequency. Whether the superposed kink propagates to the left or right depends on the initial phase of the superposition state, verifying its quantum coherence. The vertical dashed lines denote the initial location of the kink.

