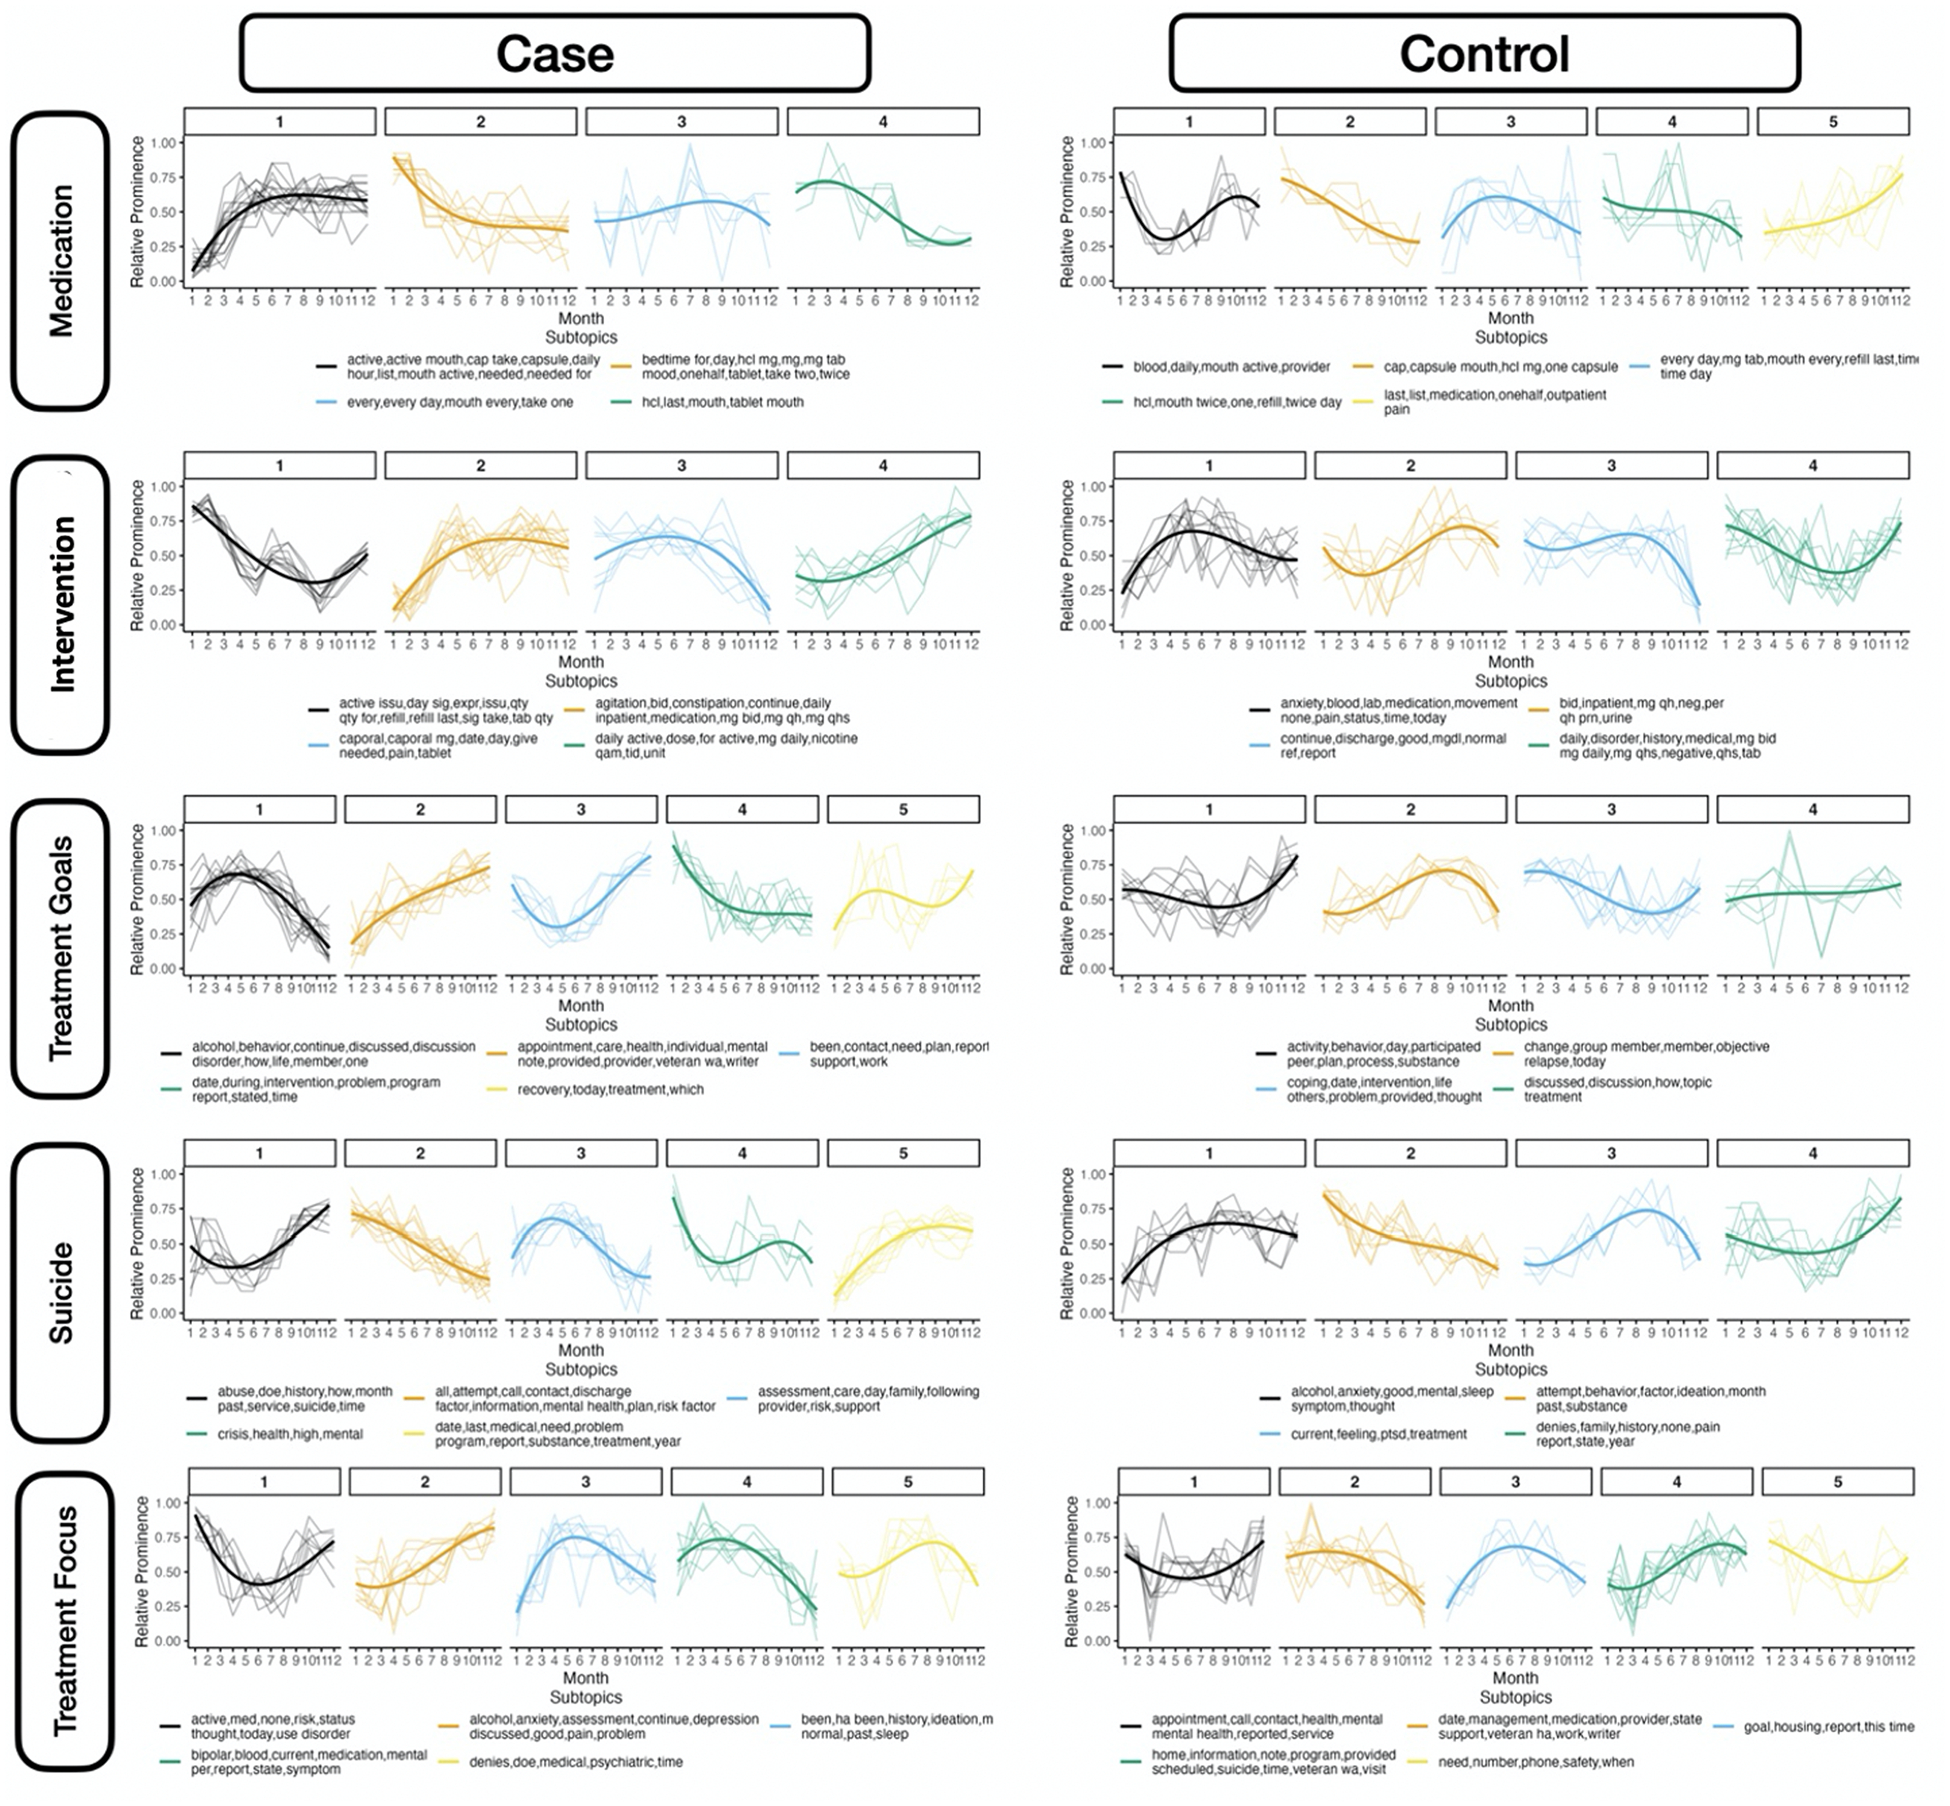
Fig. 1. Dynamic Time Warping Sub-Topic Trajectories.

This figure presents the relative prominence of identified terms (“sub-topics”), clustered from the top 50 most prominent words per topic across time within each topic that had comparable rates of change. Clustering was accomplished using dynamic time warping followed by hierarchical clustering with additional filtration of words and sub-topics. The thick line indicates overall trend per sub-topic, estimated by fitting a third-order polynomial to the data. The X-Axis presents Time (1 is index month, 12 is suicide for cases/end of observation for controls). The Y-axis presents Relative Prominence (higher values are more prominent).
