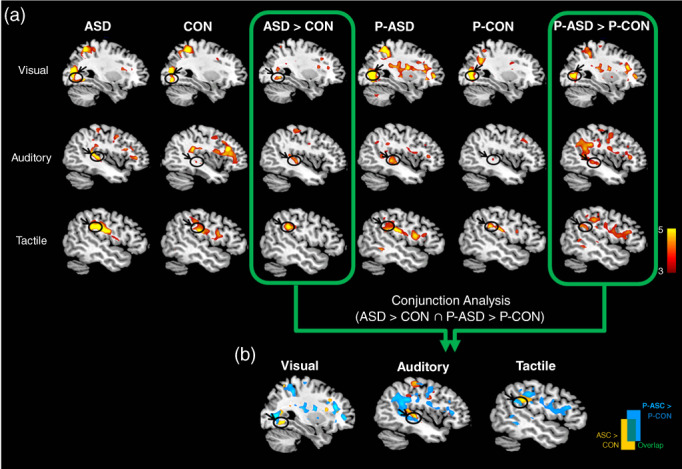
Fig. 2.

fMRI results. (a) Hemodynamic responses to sensory stimuli (visual, auditory, and tactile) within and between four groups. (b) Common areas of increased activations in two pairs of group‐difference maps for each (ASD > CON ∩ P‐ASD > P‐CON) are identified with conjunction analyses.
