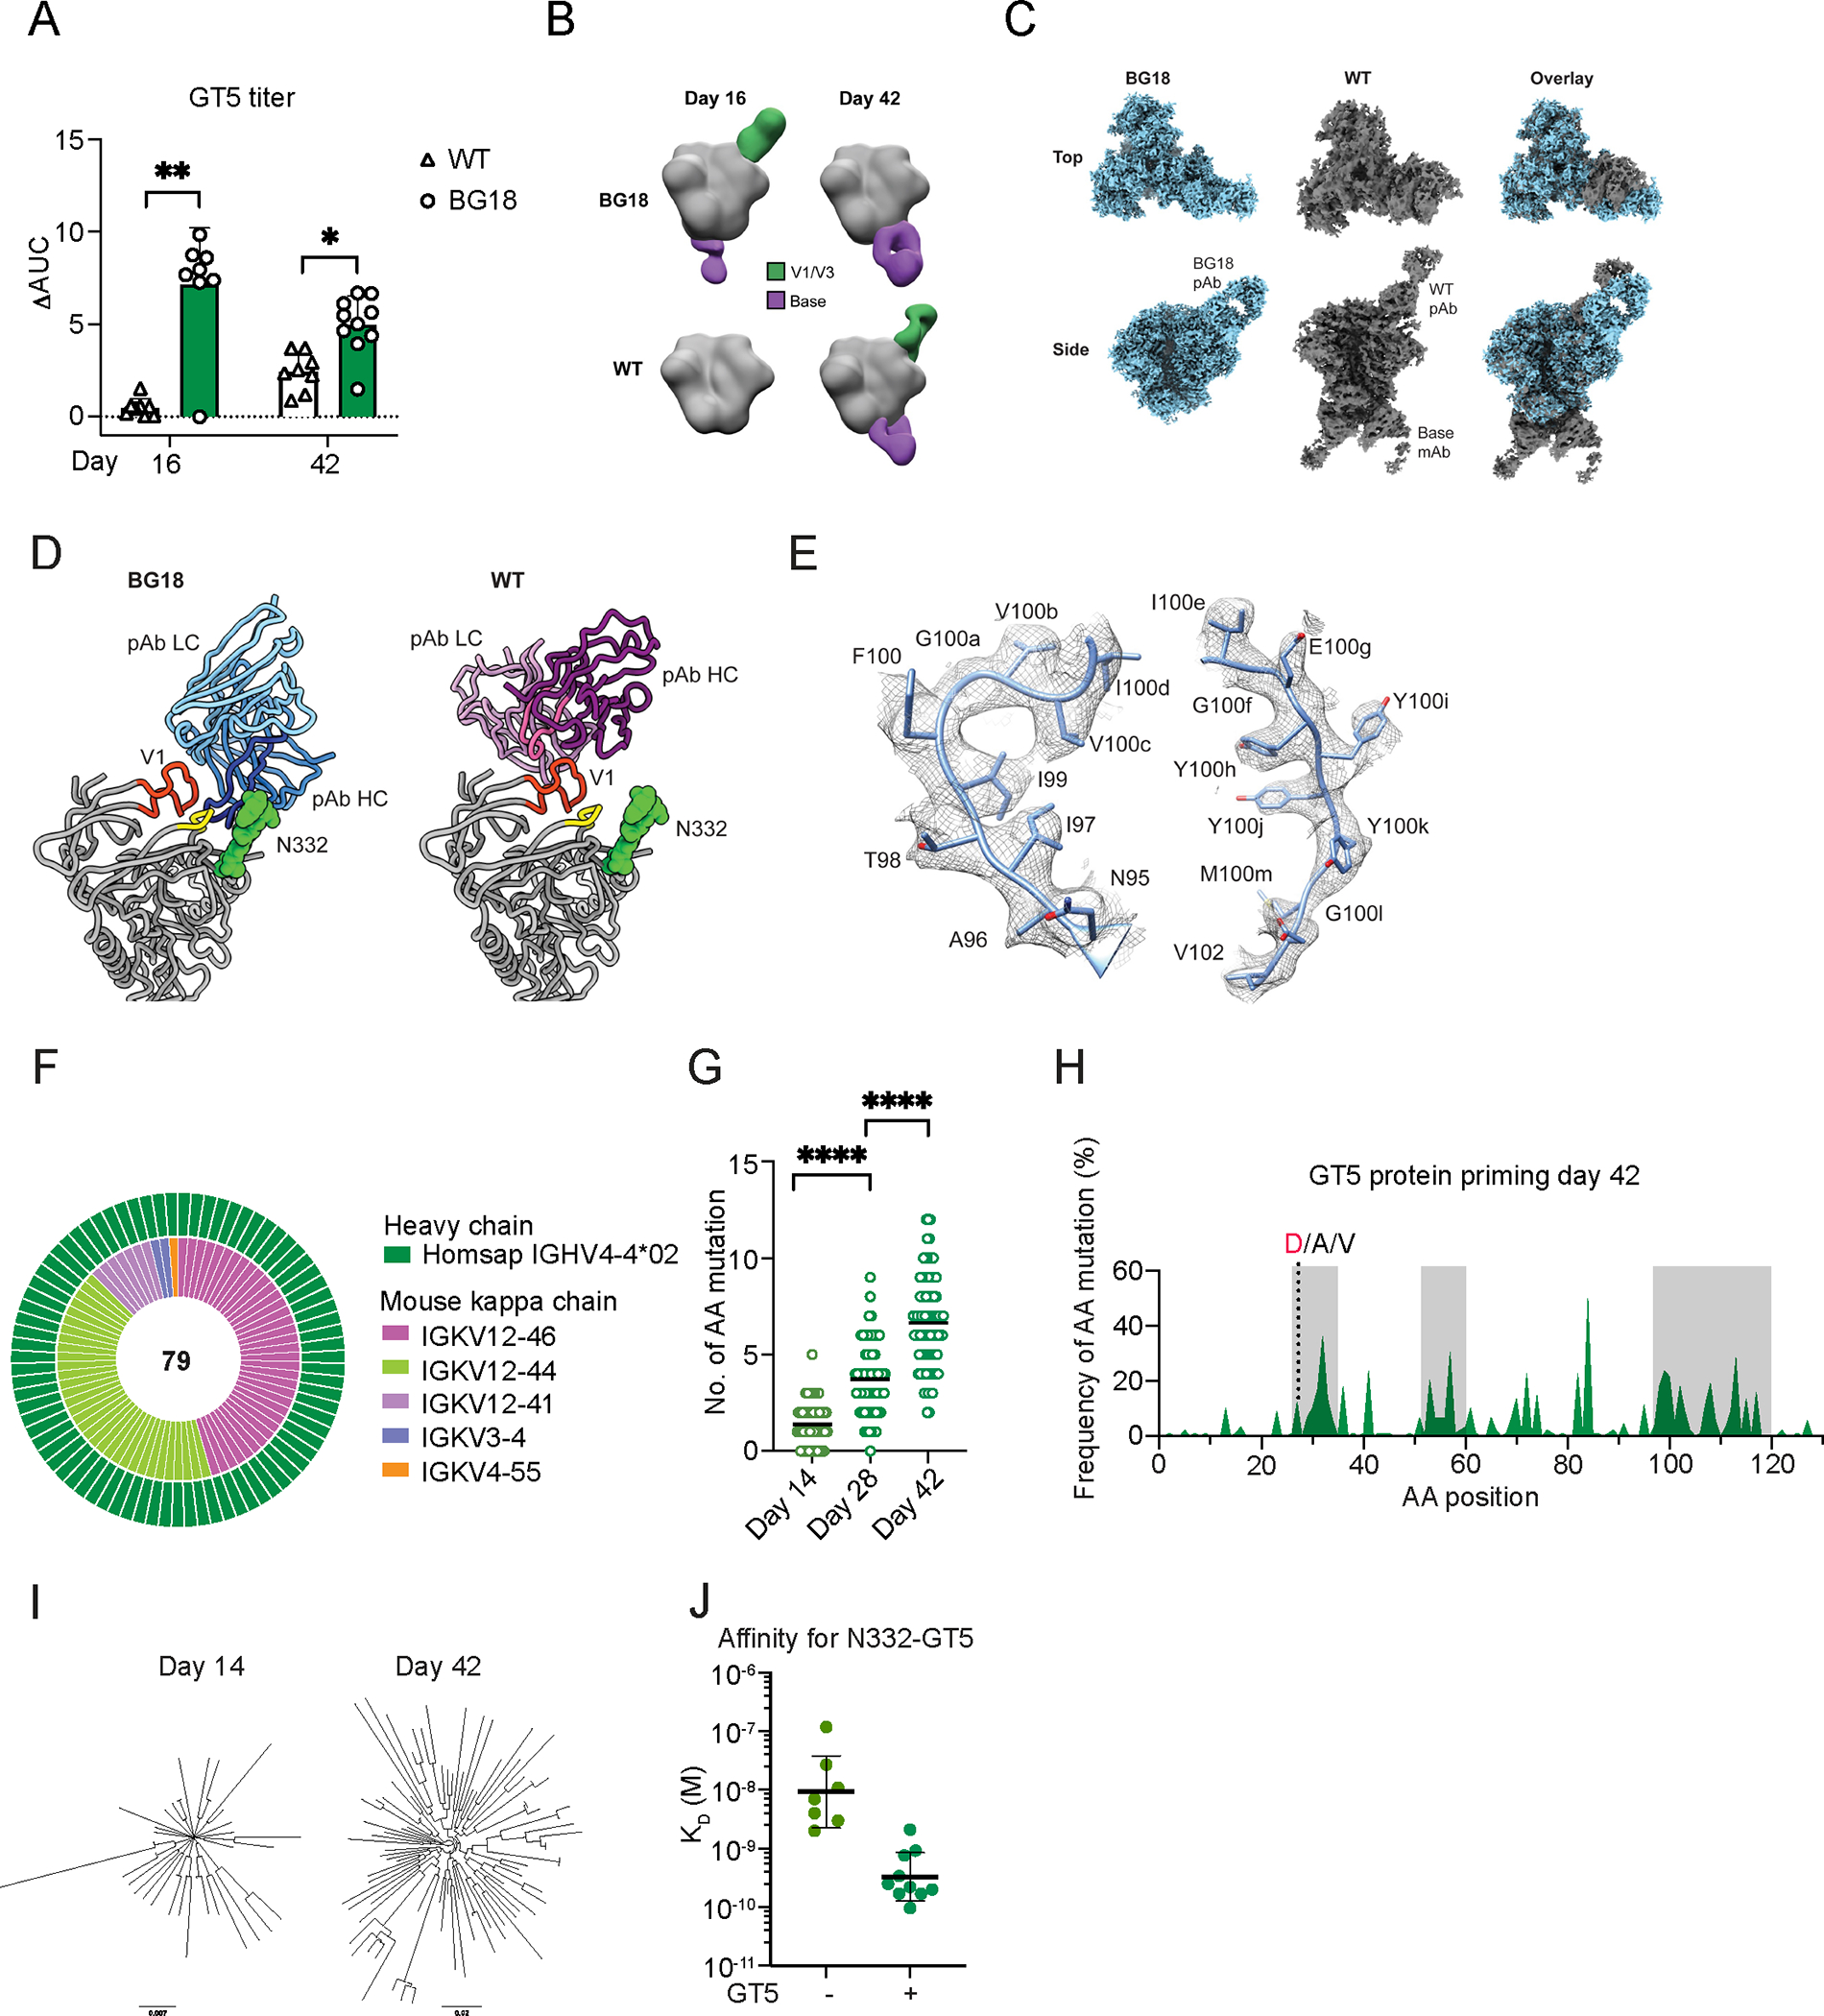
Figure 2. N332-GT5 trimer protein drives BG18gH somatic hypermutation and affinity maturation.

(A) ELISA quantification of N332-GT5-specific IgG 16 and 42 dpi by N332-GT5 protein trimer. ΔAUC (Delta area under the curve) compared for N332-GT5 and N332-GT5-KO. Each symbol represents a different mouse: WT (triangle), BG18gH (circle). Samples are pooled from 2–3 experiments with 8–10 mice per group. 2-way ANOVA with Bonferroni multiple comparison test used; bars indicate mean + SD. *p < 0.05, **p < 0.01. (B) Composite nsEMPEM maps of serum pAb responses in immunized animals, 16 and 42 days after GT5 immunization. Sera were pooled for each timepoint: BG18gH (GT5), n=10; WT (GT5), n=8. (C) Cryo-EM reconstructions of polyclonal complexes presented in (B). pAbs from both timepoints were combined. Estimated resolutions: BG18 ~3.2 Å, WT ~ 4.2 Å. (D) Atomic models of BG18 or WT pAb backbones with their respective epitopes highlighted. V1 (HXB2 133–155) in orange, co-receptor GDIR motif (HXB2 324–327) in yellow. CDRH3 of each pAb highlighted in dark blue (BG18) or bright pink (WT). (E) Cryo-EM map of CDRH3 of BG18 mouse pAb with inferred germline BG18 monoclonal model (PDB 6dfh) relaxed into the density. (F–J) Sequencing and affinity of BCRs from epitope-specific CD45.2+ cells. (F) Nested pie chart of paired single-cell BCR sequences 42 dpi. Outer layer shows BG18 IGHV; inner layer murine IGKV. (G) Heavy chain AA mutations across all sites 14, 28 and 42 dpi. Statistical analysis made using Kruskal-Wallis test. Bars indicate mean; ****p < 0.0001. (H) Per site heavy chain AA mutation frequency 42 dpi. Red letters represent key BG18 mature or mature-like mutation; grey letters show other mutations on the key residue sites. CDRs are boxed in grey. (I) Phylogenetic trees of HCs 14 and 42 dpi. Tree scale (0.007 at left and 0.02 at right) indicates the number of substitutions per site. (J) SPR dissociation constants (KD) for Fabs derived from GT5+KO− naive B cells in non-immunized BG18gH mice and GT5+KO− GC CD45.2+ B cells in BG18gH adoptive transfer recipients 42 dpi. Each symbol corresponds to a different Fab and represents one or two measurements. Bars indicate geometric mean and geometric SEM; n=7 or 10 Fabs. The Kd values for non-immunized mice are reproduced from Fig. 1D for comparison.
