. 2024 Oct 18;13:RP96459. doi: 10.7554/eLife.96459

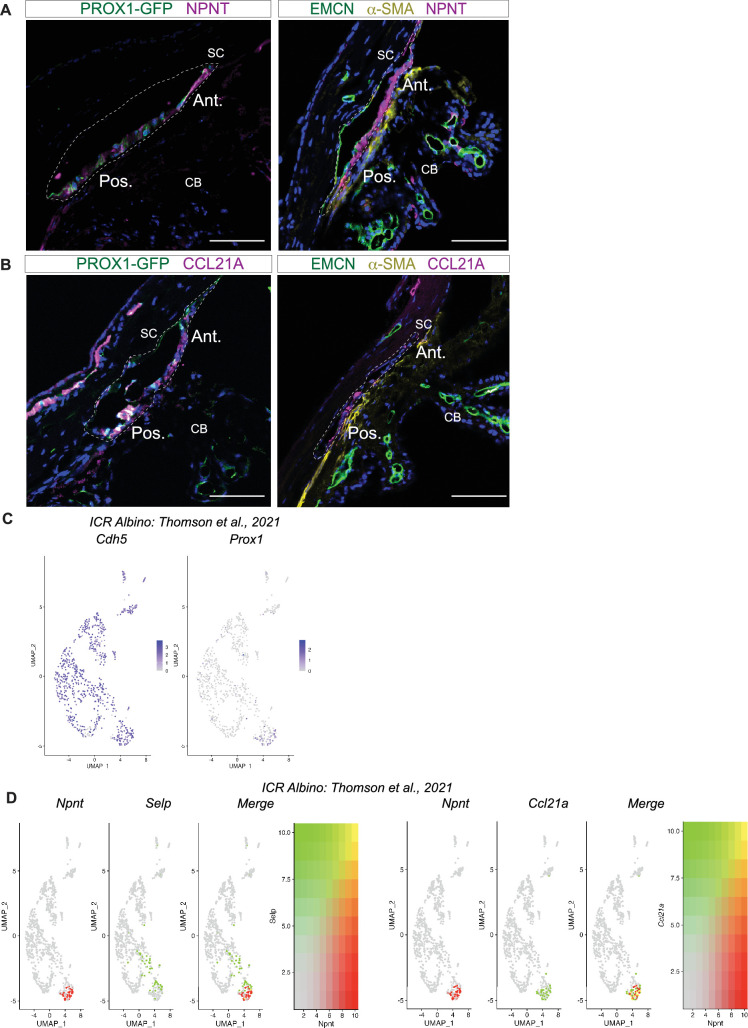
Figure 5. Immunofluorescence validates cell types and discovers bias for discrete localization of IW1 and IW2 cells.

(A) Npnt expression in a subgroup of SEC in scRNA-seq data (i) and corresponding immunofluorescence (IF) reveals high level of expression of NPNT in anterior portion of IW of SC in a frozen section (ii) and whole mount (iii and iv). (B) Ccl21a is expressed in SECs and LECs (i) and corresponding IF reveals high expression in posterior portion of IW of SC in a frozen section (ii) and whole mount (iii and iv). (C) Selp is expressed in OW SECs and CCs, a subgroup of SECs in single-cell (i) and corresponding IF (ii frozen section, iii-iv whole mount). (D) Ackr1 expression in a subset of CC cells (i) and corresponding IF (ii frozen section, iii whole mount). DAPI in blue labels nuclei in all panels. IW: Inner wall, OW: Outer wall, CC: Collector channels, CB: Ciliary body, LY: Lymphatic vessels, BV: Blood vessels SC: Schlemm’s canal. Ant.: Anterior SC, Post.: Posterior SC. Scale bar = 100μm.

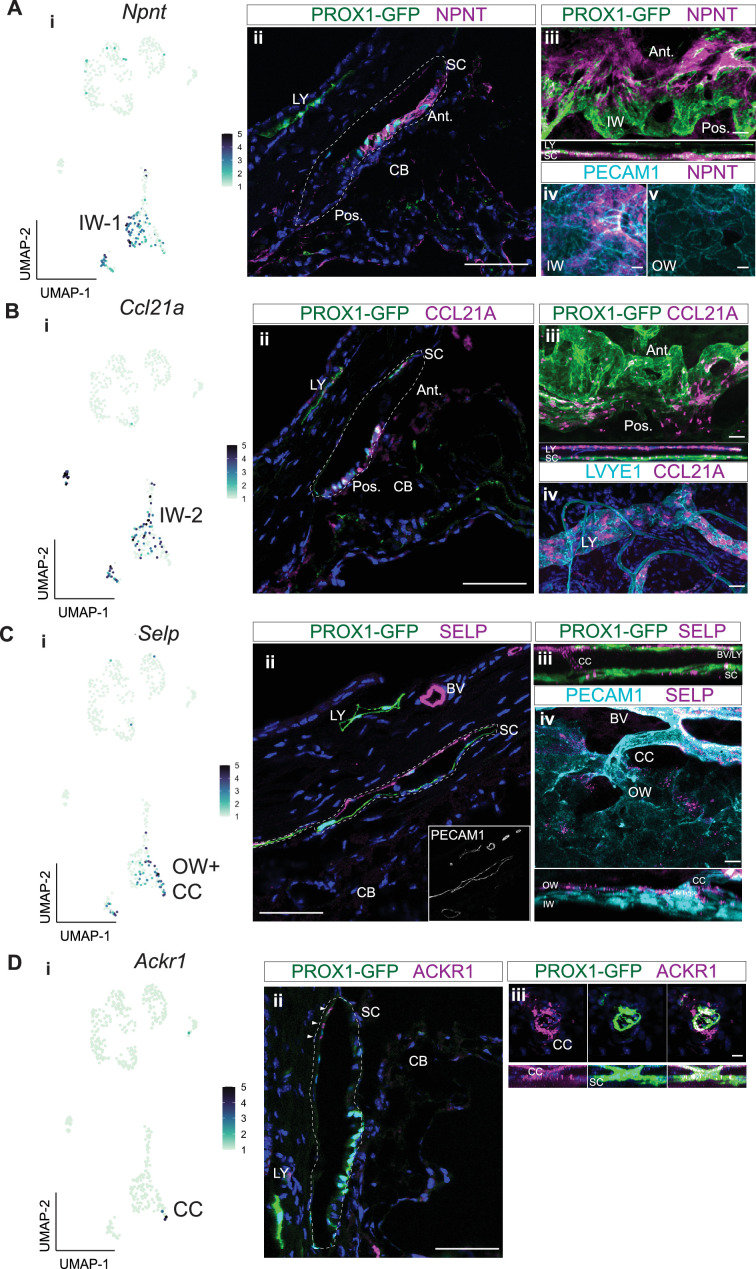
Figure 5.

Figure 5—figure supplement 1. Biased but variable localization of NPNT and CCL21A in IW of SC.

Figure 5—figure supplement 1.

(A) Immunofluorescence (IF) of NPNT shows variability in expression with a gradient of high expression in the anterior portion of SC (left panel) and uniform expression throughout IW of SC (middle panel) in flash-frozen sections. In situ hybridization using RNAscope shows the expression of Npnt in IW with an anterior expression bias (left panel) (B) IF of CCL21A shows variability in expression with a gradient of high expression in the posterior portion of SC (right panel) and uniform expression throughout IW of SC (left panel) in flash-frozen sections. DAPI in blue labels nuclei in all panels. (C, D) Gene expression analysis of endothelial cell subset in published dataset (Thomson et al., 2021) shows similar segregation of Npnt, Selp, and Ccl21a expression in SECs as seen in our dataset. CB: ciliary body, SC: Schlemm’s canal. Ant.: Anterior Schlemm’s canal, Post.: Posterior Schlemm’s canal. Scale bar = 100μm.
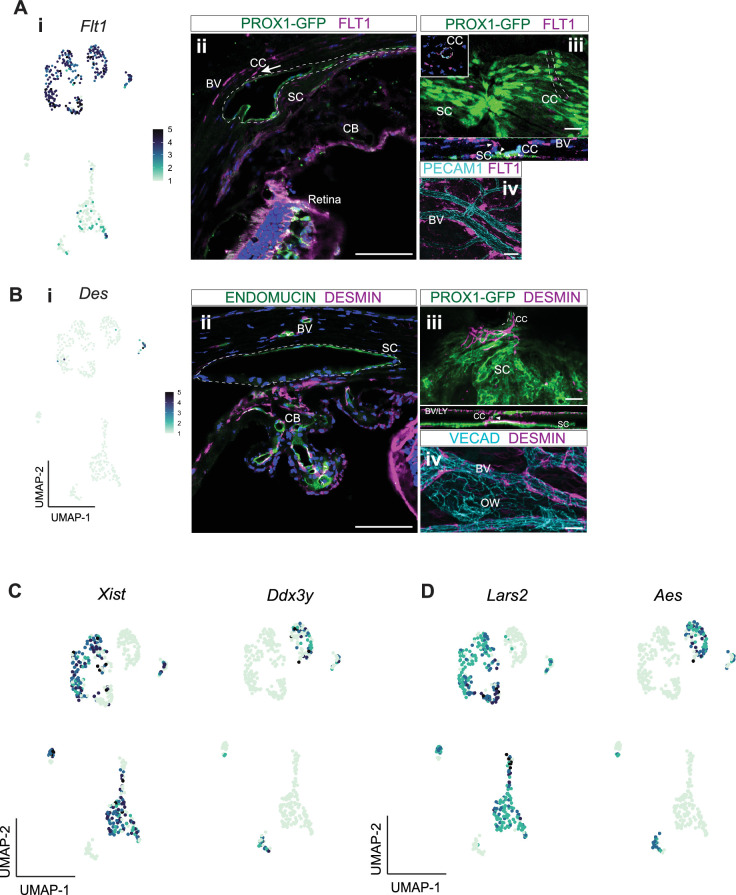
Figure 5—figure supplement 2. Collector channels, pericytes, and sex-dependent differences within the major EC cluster.

Figure 5—figure supplement 2.

(A) Flt1 is expressed primarily in BECs and in a small subset of SECs in scRNA-seq analysis (i) and corresponding immunofluorescence (IF) of FLT1 in frozen section (ii) and whole-mount (iii-iv). (B) Des is expressed in pericytes, a subgroup of BECs in scRNA-seq analysis (i). Corresponding IF analysis shows its expression in pericytes along collector channels (ii, frozen section, iii-iv whole mount). DAPI in blue labels nuclei in all panels. (C) Sub-clustering of SECs and sex-specificity of endothelial cells. Sex-specific gene expression of Xist, Ddx3y, Lars2, Aes in ‘male’ and ‘female’ clusters of endothelial cells. CC: Collector channel, CB: Ciliary body, OW: Outer wall, BV: Blood vessel, SC: Schlemm’s canal. Scale bar = 100μm.
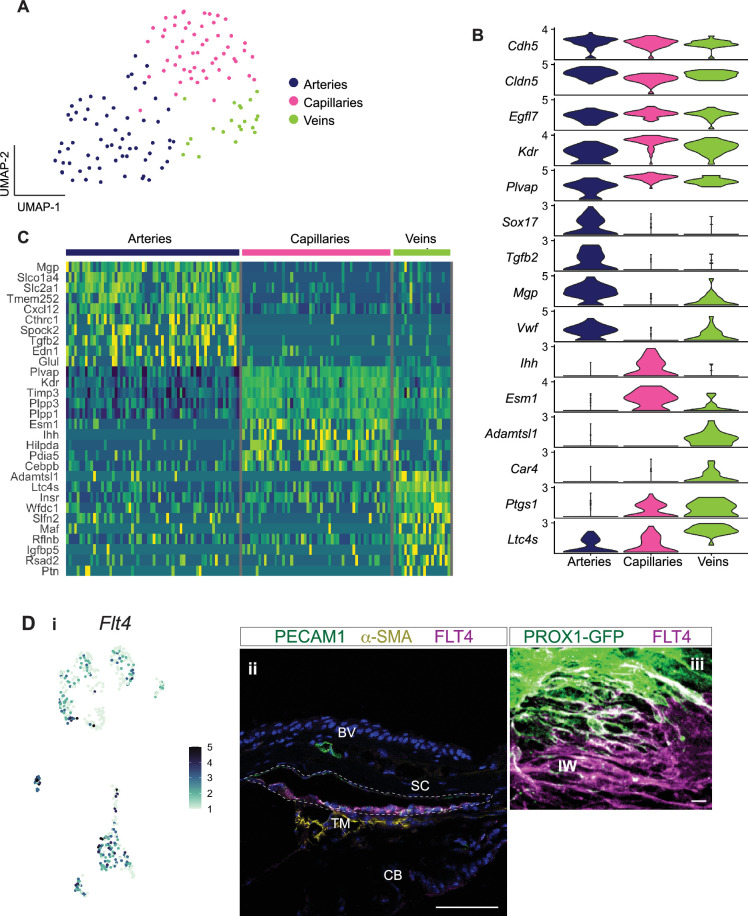
Figure 5—figure supplement 3. Main BEC types within major EC cluster and immunofluorescence confirmation of greater lymphatic polarization of IW.

Figure 5—figure supplement 3.

(A) UMAP rendering of BECs subclustered into arteries, capillaries, and veins. (B, C) Violin plot and heatmap showing differential gene expression between arteries, capillaries, and veins in limbal BECs. (D) Flt4 is expressed at mid or low levels in SECs and BECs in scRNA-seq analysis (i) and corresponding IF of FLT4 (ii frozen section, iii-iv whole mount). DAPI in blue labels nuclei. BV: Blood vessel, SC: Schlemm’s canal, CB: Ciliary body, TM: Trabecular meshwork, IW: Inner wall. Scale bar = 100μm.