. 2024 Oct 18;13:RP96459. doi: 10.7554/eLife.96459

Figure 7. Predicted ligand-target analysis reveals signaling pairs between TM and SC.

(A) (B) Circos plots depicting predicted ligand-target interaction between genes expressed in SECs and those in surrounding trabecular meshwork cells. (C) Gene ontology analysis of genes enriched in SC. (D) Heatmap of genes in individual enriched pathways showing their expression in endothelial cell subsets.

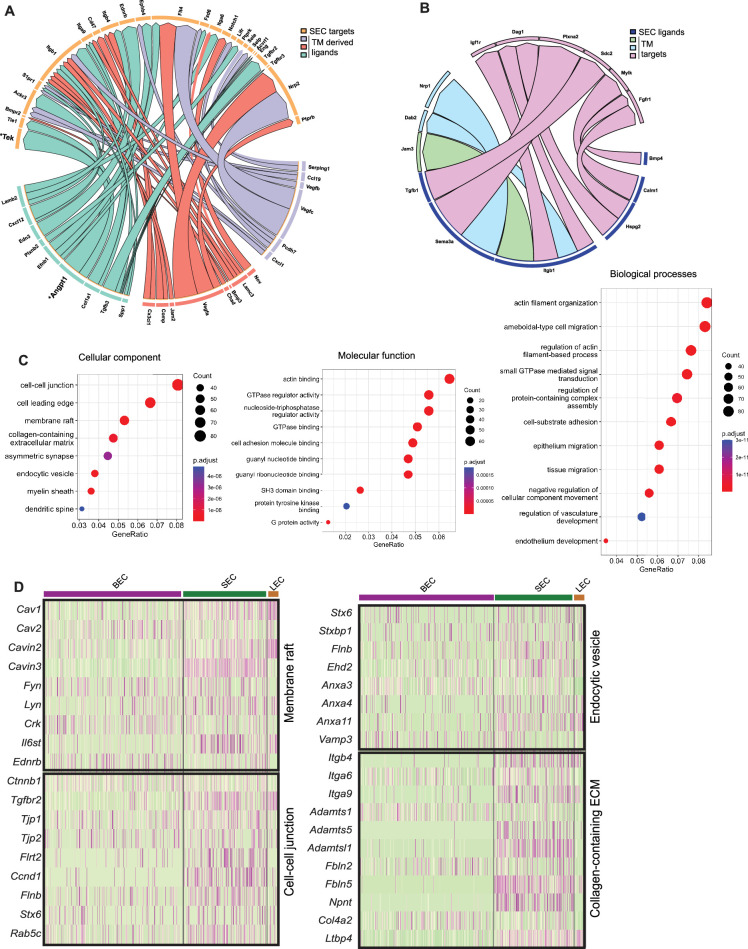
Figure 7.

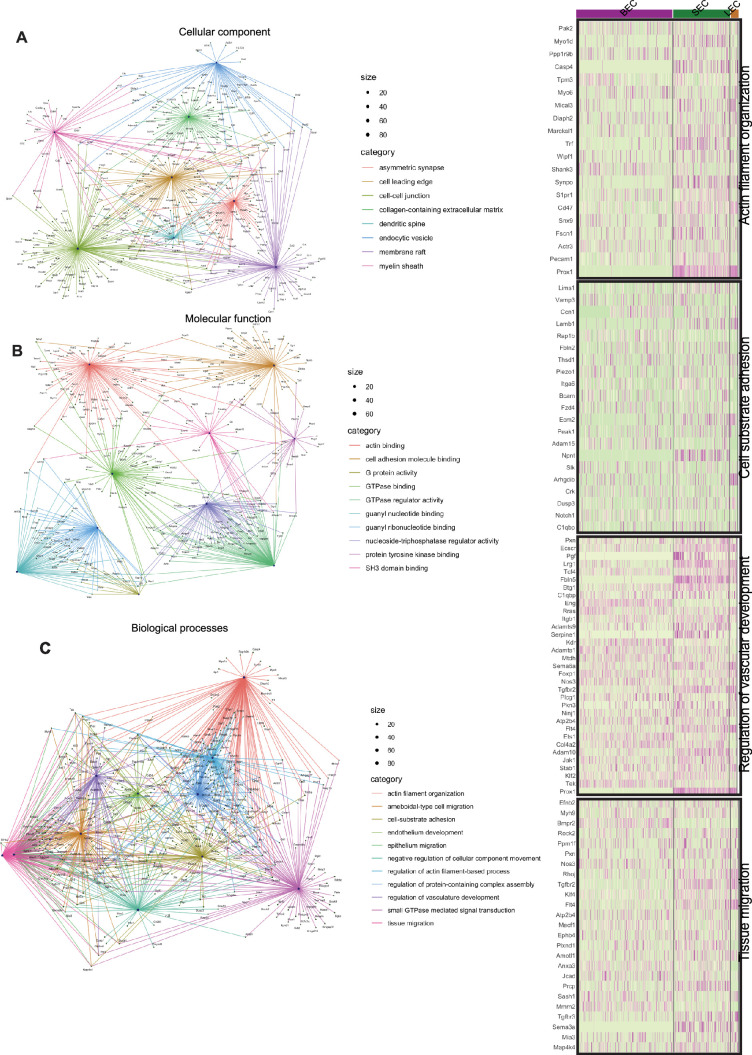
Figure 7—figure supplement 1. Gene ontology enrichment analysis highlights key cellular component/ pathways in SECs.

Figure 7—figure supplement 1.

(A-C) C-Net plot showing network between individual genes in enriched pathways identified by gene ontology analysis.
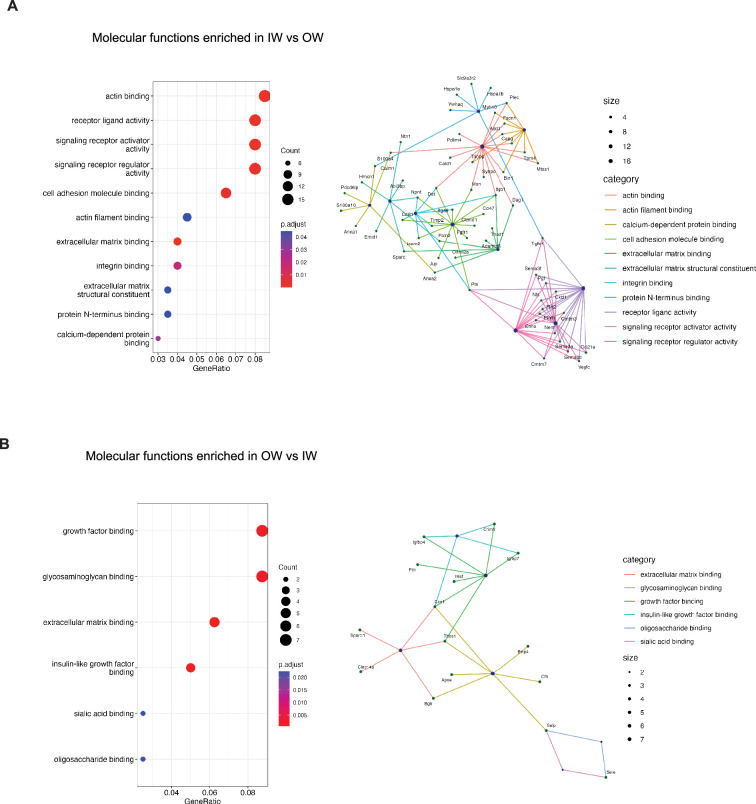
Figure 7—figure supplement 2. Gene ontology enrichment analysis highlights key pathways in IW and OW SECs.

Figure 7—figure supplement 2.

(A–B) Molecular function pathway genes enriched in IW and OW SECs and corresponding c-net plot showing network between individual genes in the pathways.