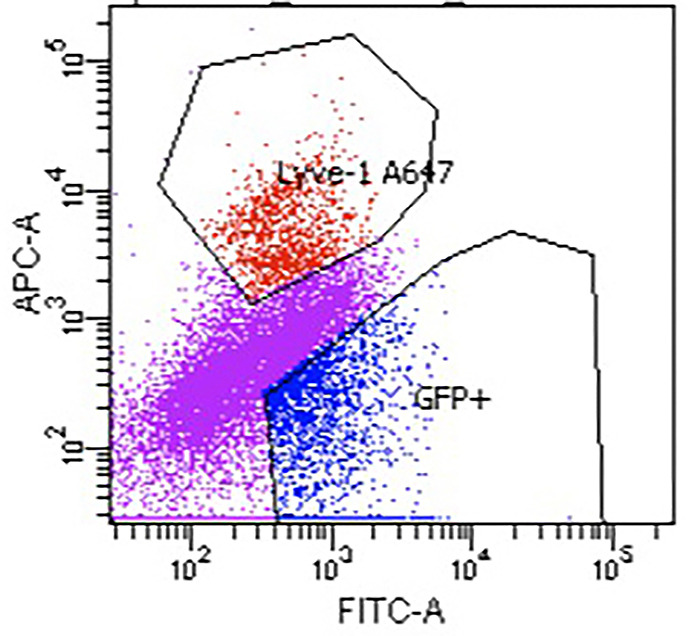
Author response image 1. Flow sorted SEC and LEC.

We obtained two distinct populations; 1. SEC cells (GPF+LYVE1--blue) 2. LEC (GPF+LYVE1+- red). Note eFluor 660 emission was collected using the Alexa647 (A647) setting of the flow cytometer. Additionally, SEC marker expression from bulk RNA-seq aligns with signature gene expression from SECs in single cell RNA-seq (Figure S3).
