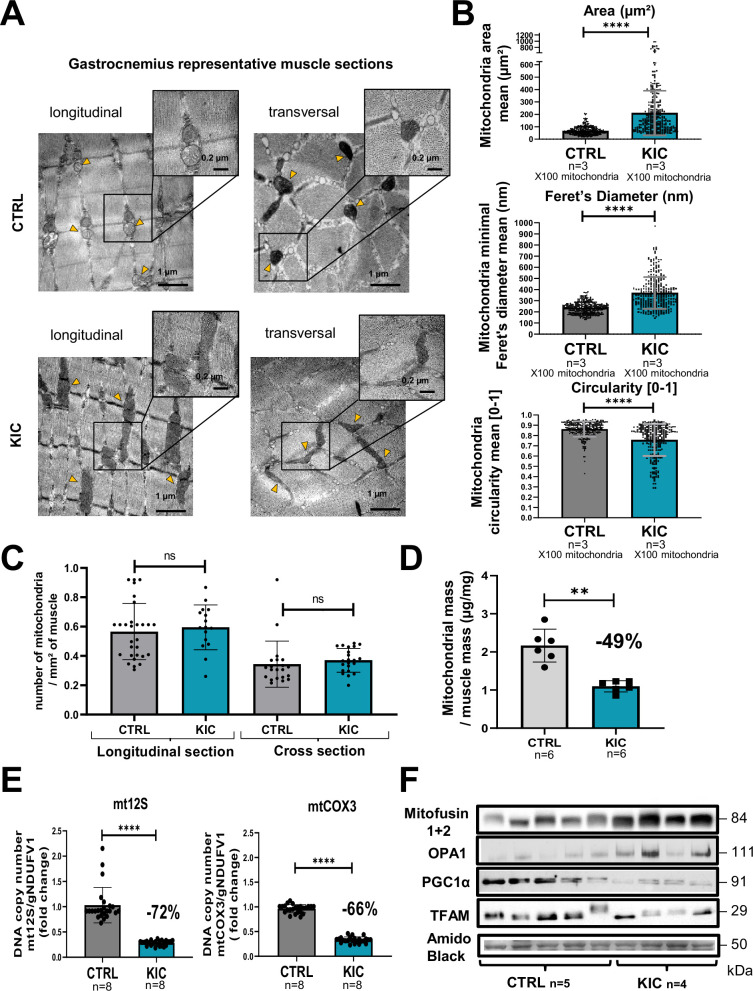
Figure 5. Mitochondrial structure is profoundly altered in cancer KIC muscles.
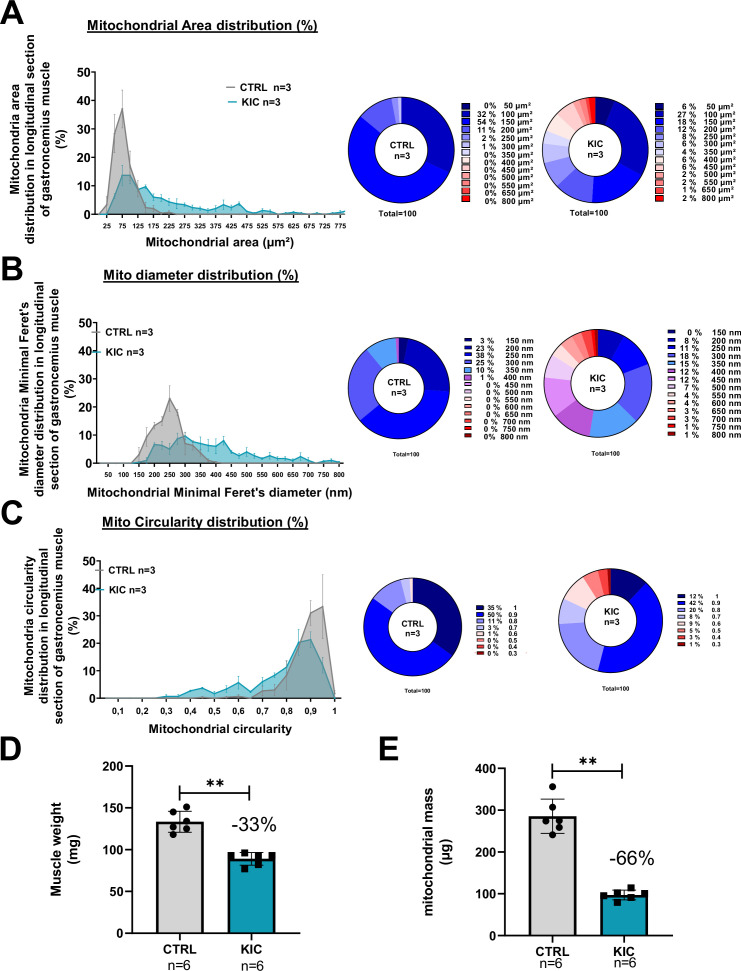
(A–C) Transmission electron microscopy (TEM) analysis of muscles showing altered mitochondria in cancer mouse muscle. (A) Representative TEM micrographs of longitudinal and transversal sections of gastrocnemius muscles from CTRL and cancer KIC mice showing mitochondrial ultrastructure. Scale bar = 1 or 0.2 µm. Yellow triangles point to mitochondria. (B) Quantification of mitochondrial morphological characteristics. From top to bottom: Mitochondrial area (µm²), mitochondrial minimal Feret’s diameter, and mitochondrial circularity in longitudinal sections of gastrocnemius muscles from CTRL healthy mice and cancer KIC mice. n=3 mice/group and 100 mitochondria measured/mouse. Data are mean ± SD. Unpaired two-tailed Mann-Whitney t-test. **** p<0.0001. (C) Quantification of the number of mitochondria per mm² in longitudinal and transversal sections of gastrocnemius muscles from CTRL healthy mice and cancer KIC mice. n=3 mice/group and 15 or more pictures have been taken and measured/mouse. Data are mean ± SD. Unpaired two-tailed Mann-Whitney t-test; ns = non-significant. (D) Mitochondrial mass of total isolated mitochondria (in µg of proteins), normalized by the related entire gastrocnemius muscle mass (in mg) in CTRL and KIC mice. Data are mean ± SD; n=6 mice/group. Unpaired two-tailed Mann-Whitney t-tests; **p<0.01. (E) Relative mitochondrial DNA content in gastrocnemius muscle of CTRL and KIC mice using relative level of mtCOX3 (left) and mt12S (right) as mitochondrial genes normalized on gNDUFV1 as nuclear gene. Data are mean ± SD, n=8 mice/group. Unpaired two-tailed Mann-Whitney t-tests, ****p<0.0001. (F) Representative immunoblots for Mitofusin1+2 and OPA1 (involved in mitochondrial fusion), PGC1α (involved in mitochondrial biogenesis), and TFAM (involved in mitochondrial DNA replication, repair, and transcription) in gastrocnemius muscle from CTRL (n=5) and KIC (n=4) mice. The loading control indicated is the Amido Black staining of the PGC1α membrane at the 50 kDa level.


