. 2024 Oct 18;13:RP93312. doi: 10.7554/eLife.93312

Figure 6. Transcriptomic analysis demonstrates multiple mitochondria-associated gene dysregulations in cancer sarcopenic muscles.

Ingenuity Pathways Analysis (IPA) showing functions, pathways, and diseases significantly dysregulated in gastrocnemius muscle of cancer KIC mice compared to healthy control mice, associated with genes of the mitochondrial interactome extracted from mitoXplorer tool with significant dysregulations (false discovery rate [FDR]>0.05)=178 genes. Each process is represented using z-score>0.5 as upregulated (blue) or downregulated (red), and the significance represented as –log(p-value) with black dots connected with a dotted line. Muscle pathways are framed by a square. Common pathways between total genes and the mitochondrial interactome are highlighted in yellow. Mitochondrial pathways are highlighted in orange. Other metabolic pathways are underlined.

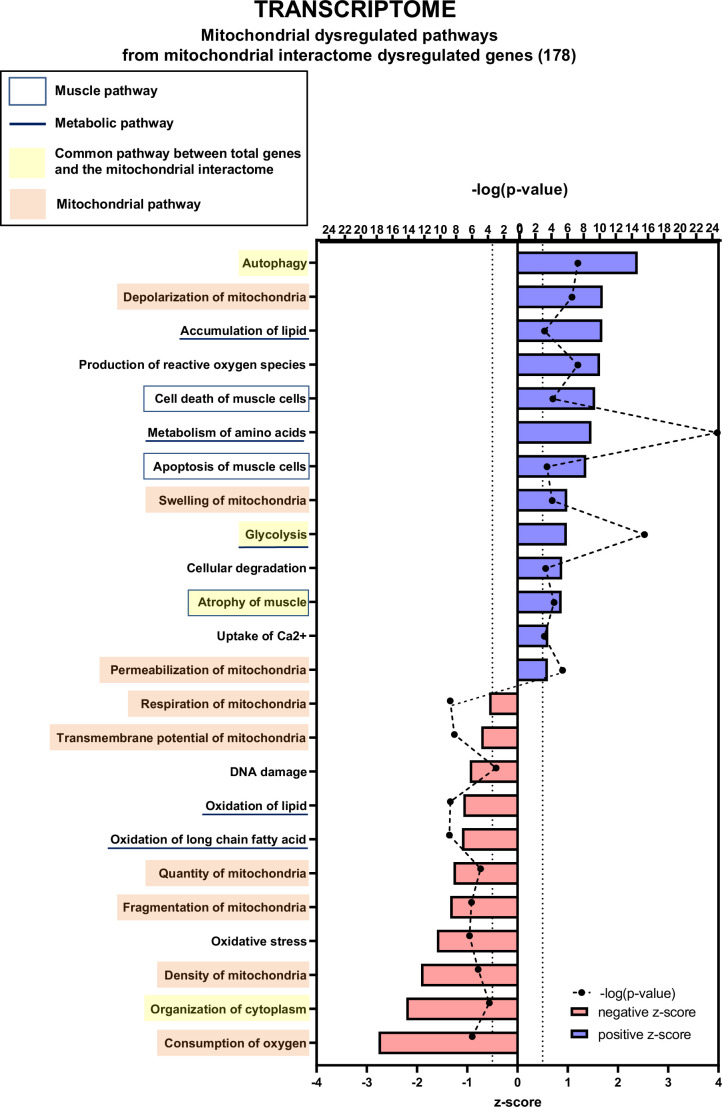
Figure 6.

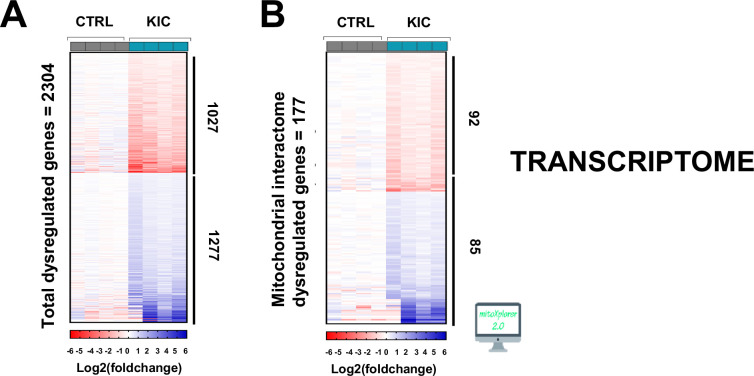
Figure 6—figure supplement 1. Transcriptomic analysis of cancer sarcopenic muscles (related to Figure 6).

Figure 6—figure supplement 1.

(A) Heatmap representing total number of dysregulated genes (false discovery rate [FDR]<0.05) in gastrocnemius muscle from cancer KIC mice (n=4) compared to healthy CTRL mice (n=4). (B) Heatmap representing dysregulated genes from mitochondrial interactome after mitoXplorer selection (FDR<0.05) in gastrocnemius muscle from the same mice as (A).
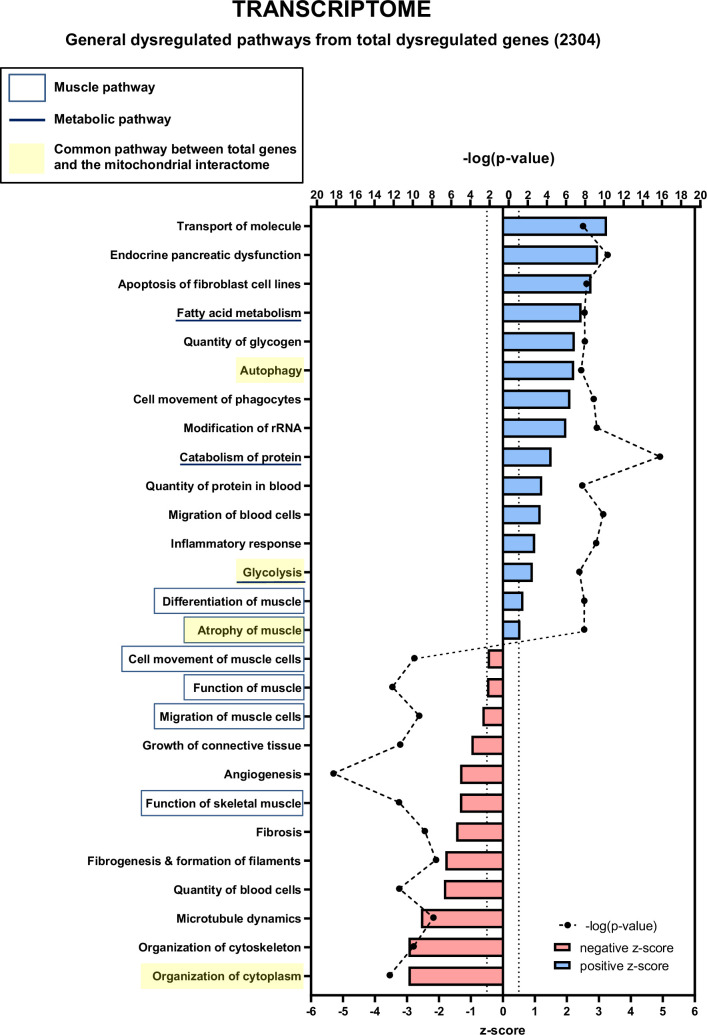
Figure 6—figure supplement 2. Transcriptomic analysis of total dysregulated genes in cancer sarcopenic muscles (related to Figure 6).

Figure 6—figure supplement 2.

Ingenuity Pathways Analysis (IPA) showing functions, pathways, and diseases significantly dysregulated in gastrocnemius muscle of cancer KIC mice compared to healthy control mice, associated with all genes with significant dysregulation (false discovery rate [FDR]>0.05)=2304 genes. Each process is represented using z-score>0.5 as upregulated (blue) or downregulated (red), and the significance represented as –log(p-value) with black dots connected with a dotted line.
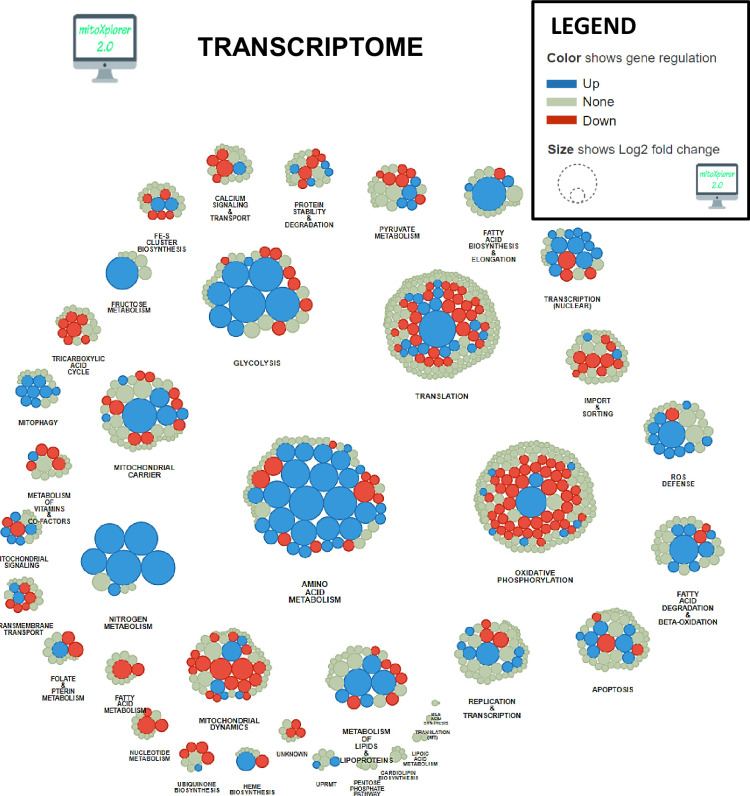
Figure 6—figure supplement 3. Mitochondrial interactome of down- or upregulated genes involved in mitochondrial processes in KIC gastrocnemius muscle compared to CTRL (muscle RNA n=4 for each condition).

Figure 6—figure supplement 3.

Genes have been selected from total dysregulated genes with false discovery rate (FDR)<0.05, and affiliated to processes after enrichment using mitoXplorer tool.
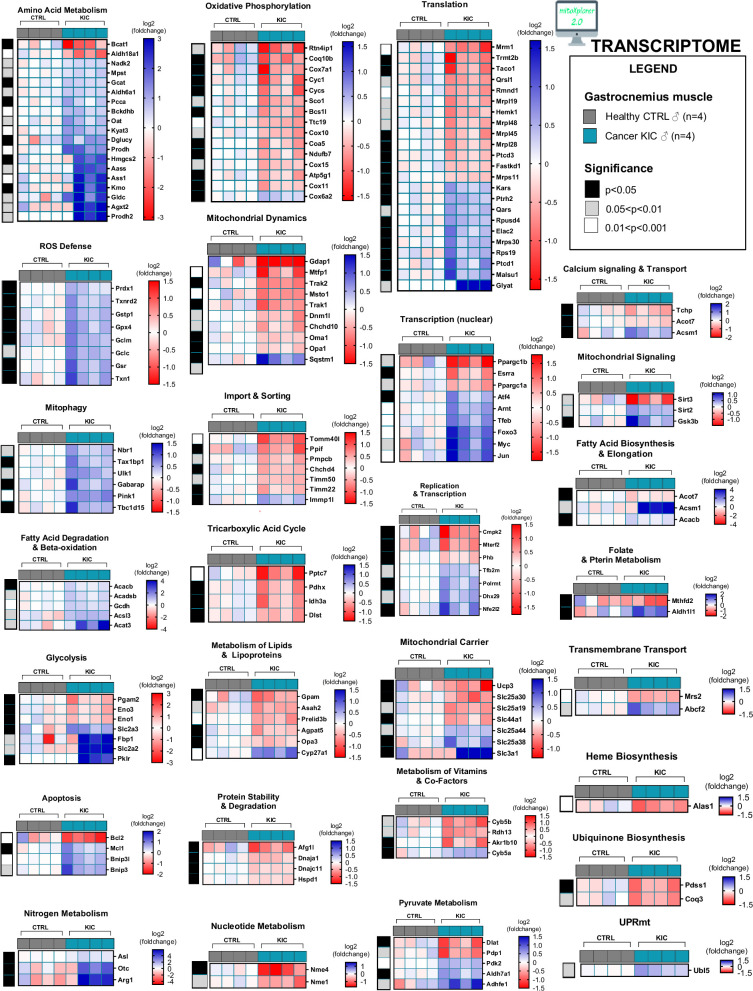
Figure 6—figure supplement 4. Cancer sarcopenic muscles demonstrate obvious mitochondria-associated genes dysregulation (related to Figure 6 and Figure 6—figure supplement 3).

Figure 6—figure supplement 4.

Heatmaps showing log2(fold change) of differentially dysregulated genes involved in mitochondrial processes (based on false discovery rate [FDR]<0.05) in cancer KIC gastrocnemius muscle compared to healthy CTRL (muscle RNA n=4 for each condition).