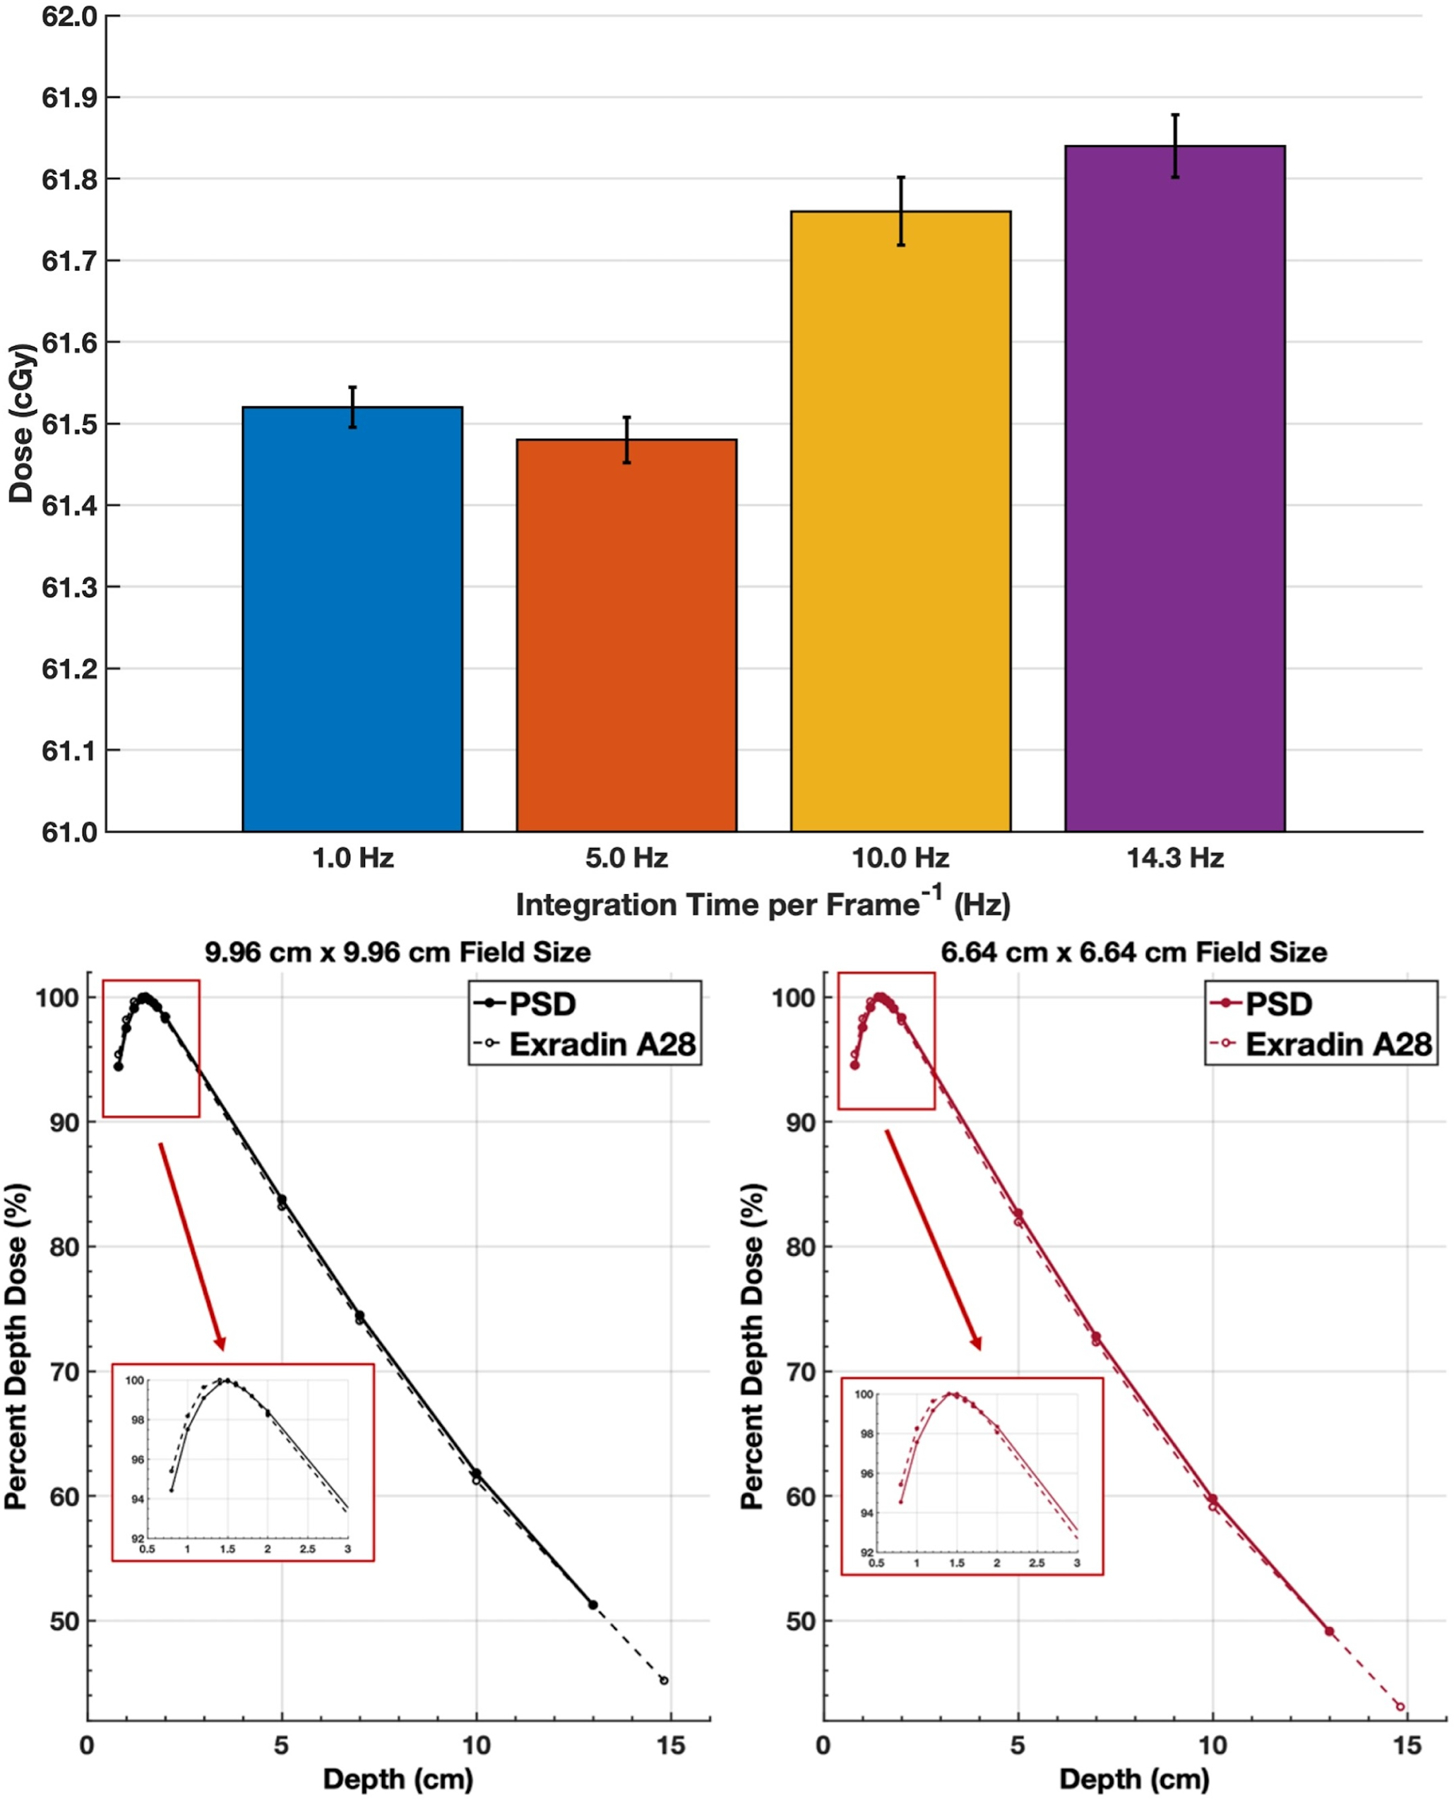
Figure 4:

Repeatability measurements and PDD curves for different frequencies corresponding to per image exposure times. Mean value (bar graph value) and standard deviation (error bar) for 10 dose measurements for different exposure times per image (1.0, 5.0, 10.0, 14.3 Hz) are shown (top). Percent depth dose curves (bottom) for a single PSD channel for a 9.96 cm and a 6.64 cm square field size, compared to annual QA measurements using an A28 ion chamber.
