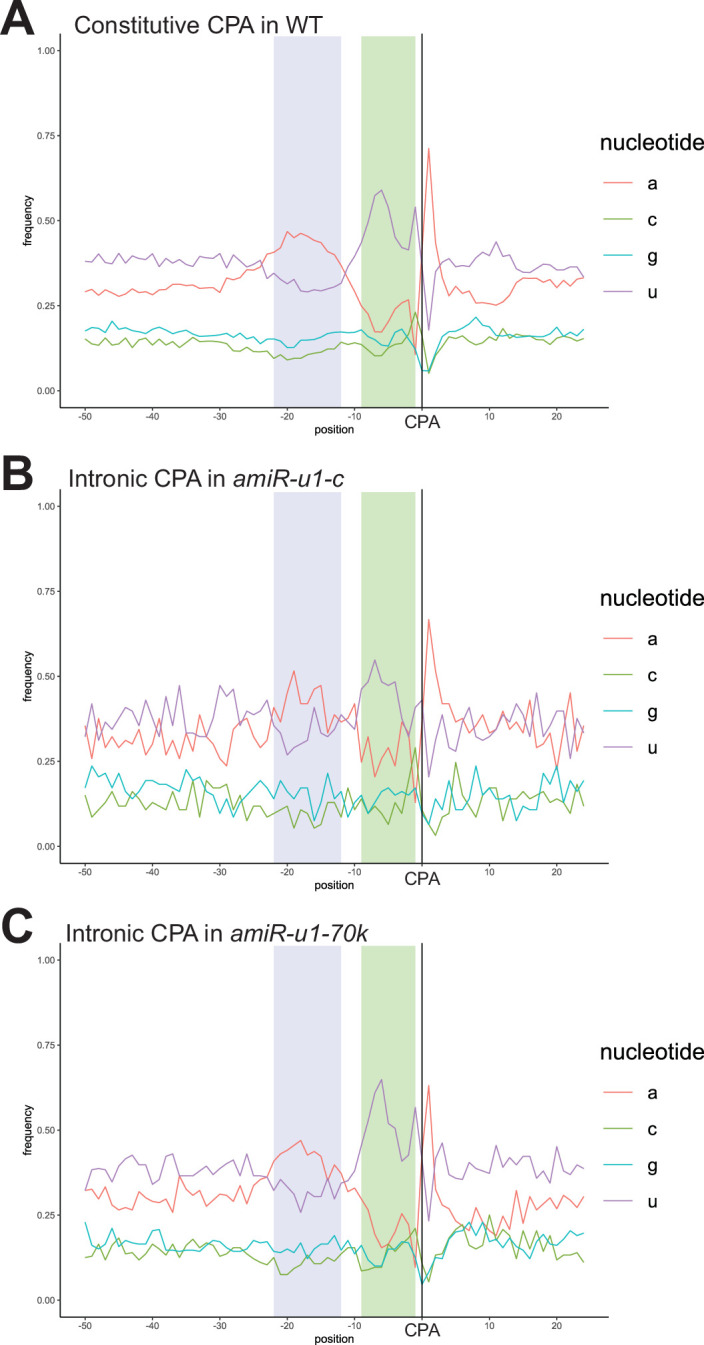
Extended Data Fig. 7. Nucleotide composition around CPA sites.

a-c: The plots depict the nucleotide composition 50 nucleotide downstream and 25 nucleotides upstream of CPA sites for constitutive CPA sites in WT plants (a), intronic CPA sites in amiR-u1-c (b) and intronic CPA sites in amiR-u1-70k (c). An A-rich region (probably reflecting the PAS, highlighted in blue) and an U-rich region (probably reflecting the DSE highlighted in green) are marked.
