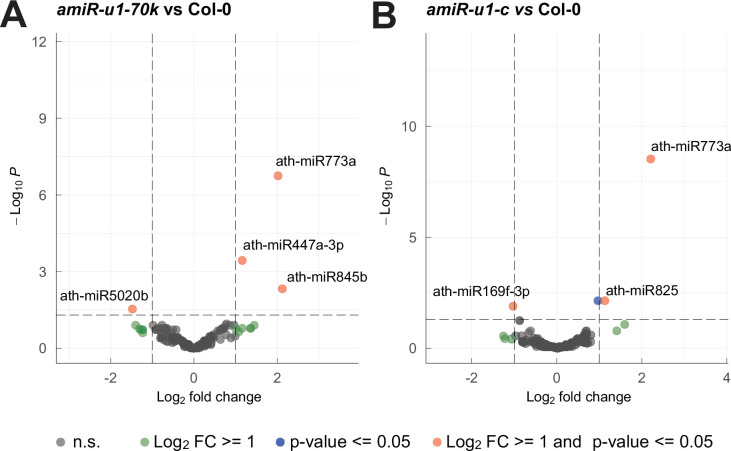
Extended Data Fig. 3. miRNA are not widely differentially expressed in U1 knockdown lines.
a, b: miRNAs expression analysis by small RNA-seq from WT, amiR-u1-70k, and amiR-u1-c plants. Volcano plots show differentially expressed miRNAs in amiR-u1-70k (a) or amiR-u1-c (b) compared to WT Col-0 plants using three biological replicates. A total of 178 miRNAs were analyzed. Grey dots depict miRNAs not significantly changed (n.s.), green dots depict miRNAs with a log2 fold change ≥ 1, blue dots depict miRNAs with an FDR ≤ 0.05, and red dots depict miRNAs with a log2 fold change ≥ 1 and an FDR ≤ 0.05.

