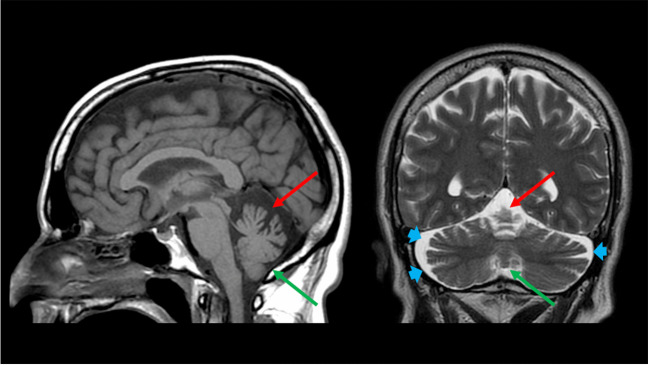
Fig. 2.
A pattern of “pure” cerebellar atrophy. Sagittal T1-weighted (left) and coronal T2-weighted (right) images of a 54-year-old male Spinocerebellar Ataxia Type 6 patient showing a pattern of “pure” cerebellar atrophy, with a concomitant involvement of the superior vermis (red arrows), and the cerebellar hemispheres (depicted by the enlargement of the cerebellar fissures with corresponding increase in CSF spaces—blue arrowheads), and a less significant although present volume loss of the inferior vermis (green arrows), with a relative sparing of the remaining brain structures

