
Fig. 5.
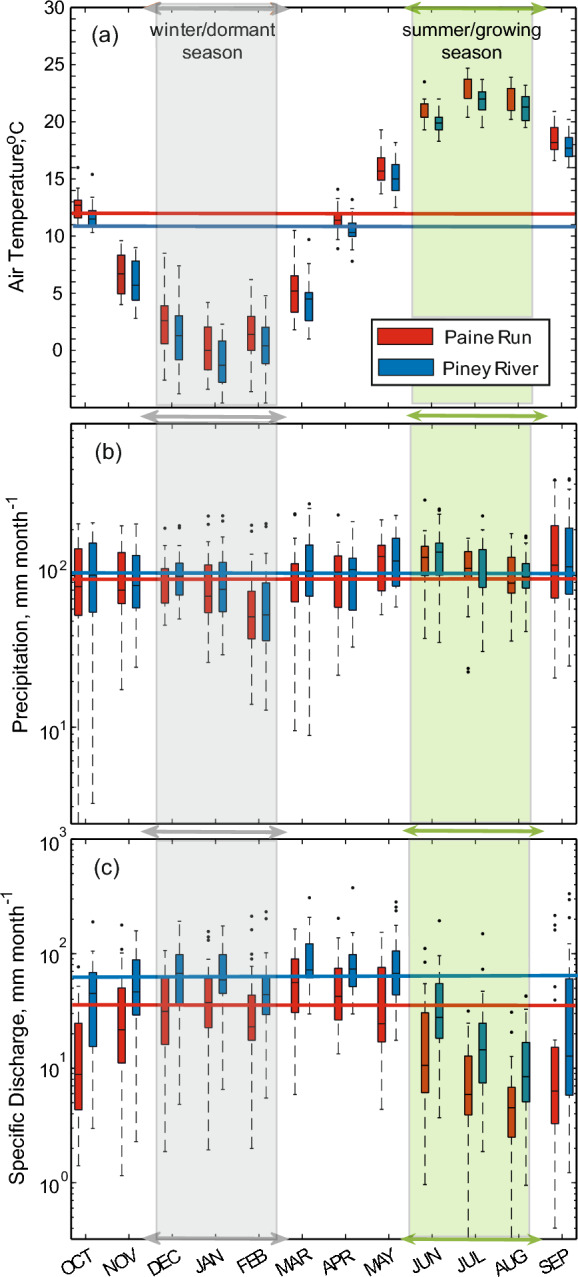
Box whisker plots (center line = median, box limits = 25 and 75th percentiles, outer lines = minimum and maximum, dots are outliers) of a monthly air temperature, b precipitation, and c specific discharge for the 1993–2017 water years at Piney River and Paine Run. Horizontal lines represent median annual values for the period, colored to match their respective site. The winter, dormant season (December, January, February) and summer, growing season (June, July, August), are indicated in each panel with grey and green arrows and shading, respectively. Monthly precipitation and air temperature data were obtained from the Parameter-elevation Regression on Independent Slopes Model (PRISM, http://prism.oregonstate.edu)