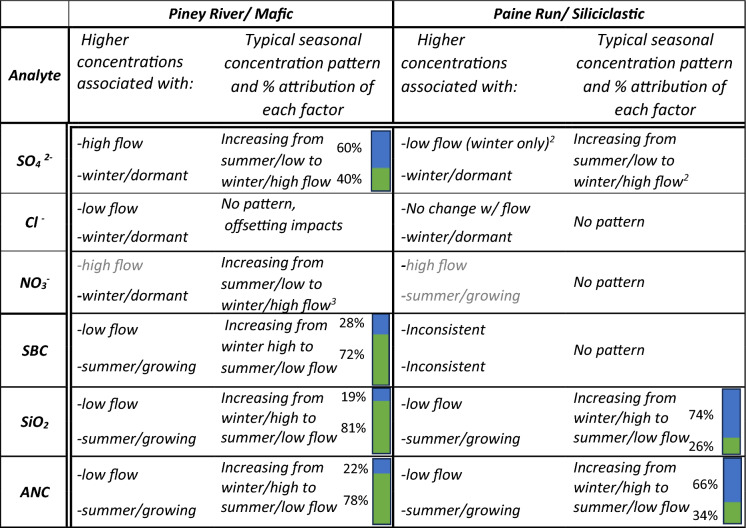
Table 2.
Summary of flow condition (low or high) and season (summer or winter) associated with higher analyte concentrations for the two study sites
Differences that are not statistically significant1 are presented in grey. The percent of both factors, hydrological flow (upper blue bar) and biogeochemical processes associated with seasons (lower green bar), attributed to the typical seasonal pattern when compounding, are shown to the left of the respective bar. Percentages were derived as described in Eqs. 1 and 2 and illustrated in Fig. 4. These values are intended to convey relative importance, not an exact attribution value
1Differences were considered significant 1) for flow if the C–Q slope for either season was statistically significant (Table S1) and 2) for season if the intercept for the C–Q lines or the concentration at mean flow were significantly different between seasons (Table S1)
2SO42− dynamics with flow at Paine Run (higher with lower flow) are not consistent with observations at quarterly siliciclastic sites indicating they may not be broadly applicable; therefore no attribution metric is calculated
3NO3 −dynamics at Piney River are compounding, however the attribution metric was not appropriate as concentrations were near detection limit in summer

