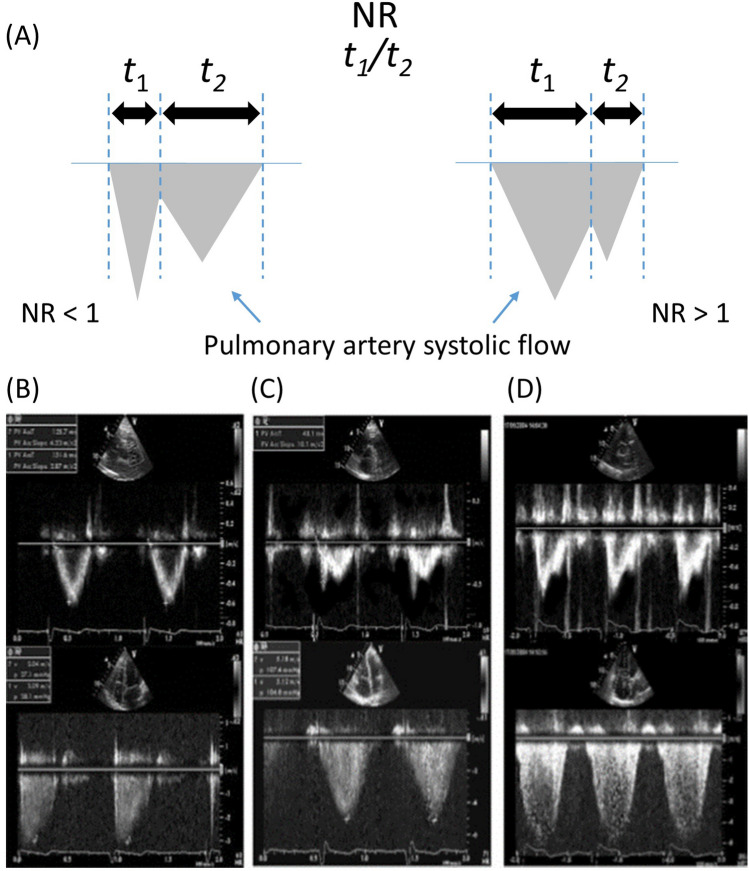
Fig. 1.
Schematic illustration of the method to calculate pulmonary flow systolic NR. A The time interval from the onset of pulmonary artery systolic flow to the maximal systolic flow deceleration (t1) was divided by the time interval from the maximal systolic flow deceleration to the end of pulmonary artery systolic flow (t2). B, top Pulmonary flow without notch of a patient with exercise-induced pulmonary hypertension (parasternal short-axis view). (Bottom) Maximal tricuspid regurgitation flow (four-chamber view), used to calculate systolic pulmonary artery pressure. (C, top) Pulmonary flow systolic notch, NR < 1.0. (Bottom) Maximal tricuspid regurgitation flow. (D, top) Pulmonary flow systolic notch, NR > 1.0. (Bottom) Maximal tricuspid regurgitation flow. Note that timing of notch differs between panels (C and D), despite similar amplitudes of tricuspid regurgitation flow. All demonstrated recordings of pulmonary flow (B–D) were performed at rest

