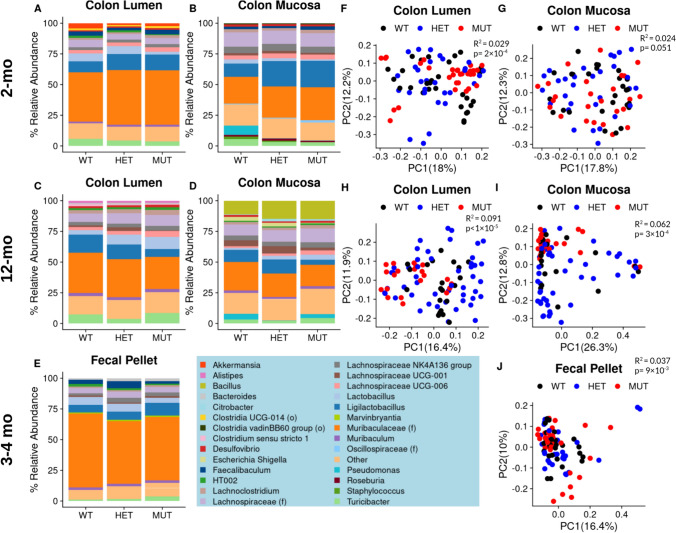
Fig. 3.
MUT mice exhibit a distinct microbiome composition in three differently aged cohorts. Taxonomic column summary plots illustrate the % relative abundance of genera which comprise at least 1% of the microbiome composition in the colonic lumen or adhered to the colonic mucosa of 2-month-old WT, HET, and MUT mice (A, B), 12-month-old mice (C, D), or the fecal pellets of 3–4-month-old mice (E). The genera color legend for all barplots is shown at the bottom of the figure. If the name of the genus is unknown, its family name (f) or order name (o) is shown. Principal coordinates analysis plots on square-root Jensen–Shannon dissimilarities illustrate the differences in microbiome composition between WT, HET, and MUT mice, with each dot representing one sample. Plots are shown for the colonic lumen or colonic mucosa of 2-month-old (F, G), 12-month-old (H, I), or the feces of 3–4-month-old (J) mice. R2 and p-values associated with the effect of Genotype are reported from PERMANOVA of sample dissimilarity matrices. The microbiome data represents n = 10 WT (4 F 6 M), n = 10 HET (4 F 6 M), and n = 10 MUT (4 F 6 M) for 2-month-old mice and n = 27 WT (11 F 16 M), n = 30 HET (10 F 20 M), and n = 31 MUT (14 F 17 M) for 3–4-month-old mice

