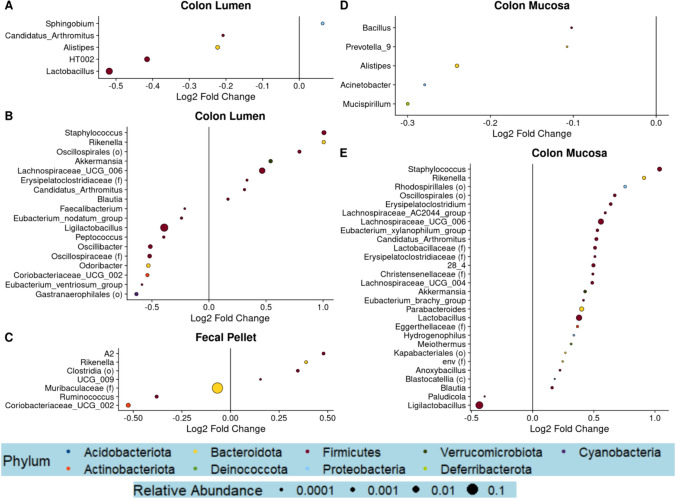
Fig. 4.
MUT mice exhibit altered abundance of several genera compared to WT mice. Differential abundance testing was performed at the genus level utilizing linear mixed-effects models of log-transformed, normalized count data. Dot plots visualizing significantly differentially abundant genera (false discovery rate-adjusted p-value, q < 0.25) between MUT and WT are shown for the colonic lumen or colonic mucosa datasets of the 2-month-old mice (A, D), the 12-month-old mice (B, E), or the fecal pellets of the 3–4-month-old mice (C). The size of the dot corresponds to the relative abundance of the genera, while the color of the dot represents the phylum

