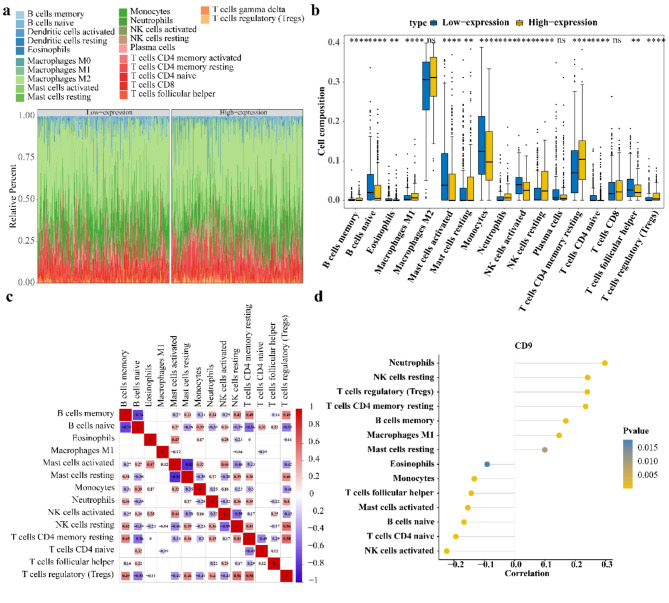
Fig. 7.
Association analysis between CD9 and immune cells. (a) The abundance of immune cells in the samples of high and low CD9 expression groups in the TCGA database; (b) The immune cells of the high and low CD9 expression groups were infiltrated differentially; Yellow represents high CD9 expression group, blue represents low CD9 expression group. (c) Differential immune cell correlation heat map; Red represents positive correlation, blue represents negative correlation, the darker the color, the higher the correlation; Blank indicates no significant (d) CD9 is associated with differential immune cells.

