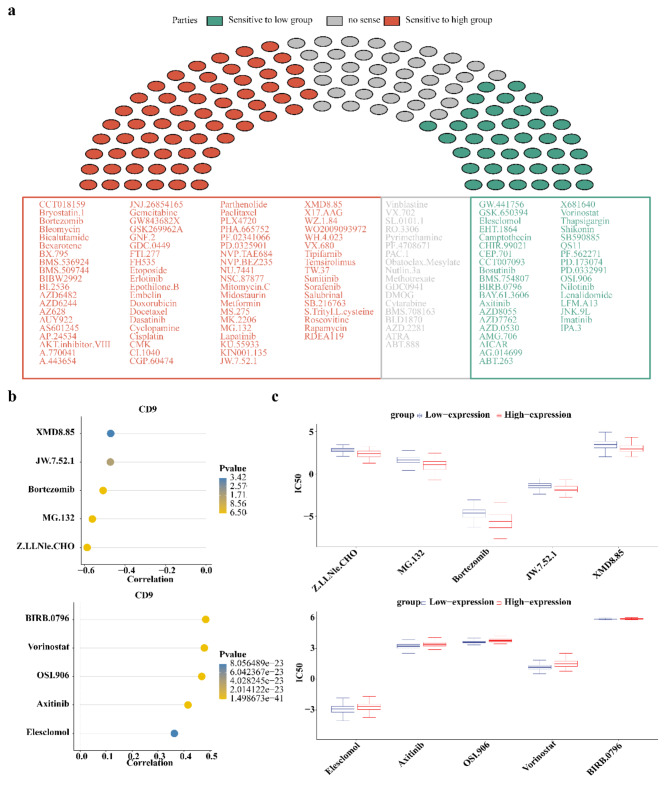
Fig. 9.
Drug sensitivity analysis of patients with high or low CD9 expression level. (a) Drug sensitivity of patients in high and low CD9 expression groups. Red indicates drugs with high sensitivity in patients with high CD9 expression, green indicates drugs with high sensitivity in patients with low CD9 expression, and gray indicates drugs with no sensitivity difference between high and low CD9 expression groups; (b) Correlation between drug IC50 and CD9. The top five drugs most negatively associated with CD9 are shown above, and the top five drugs most positively associated with CD9 are shown below. (c) IC50 values of the top5 drugs most positively and negatively correlated with CD9. The top 5 drugs most negatively correlated with CD9 are shown above, and the top 5 drugs most positively correlated with CD9 are shown below.

